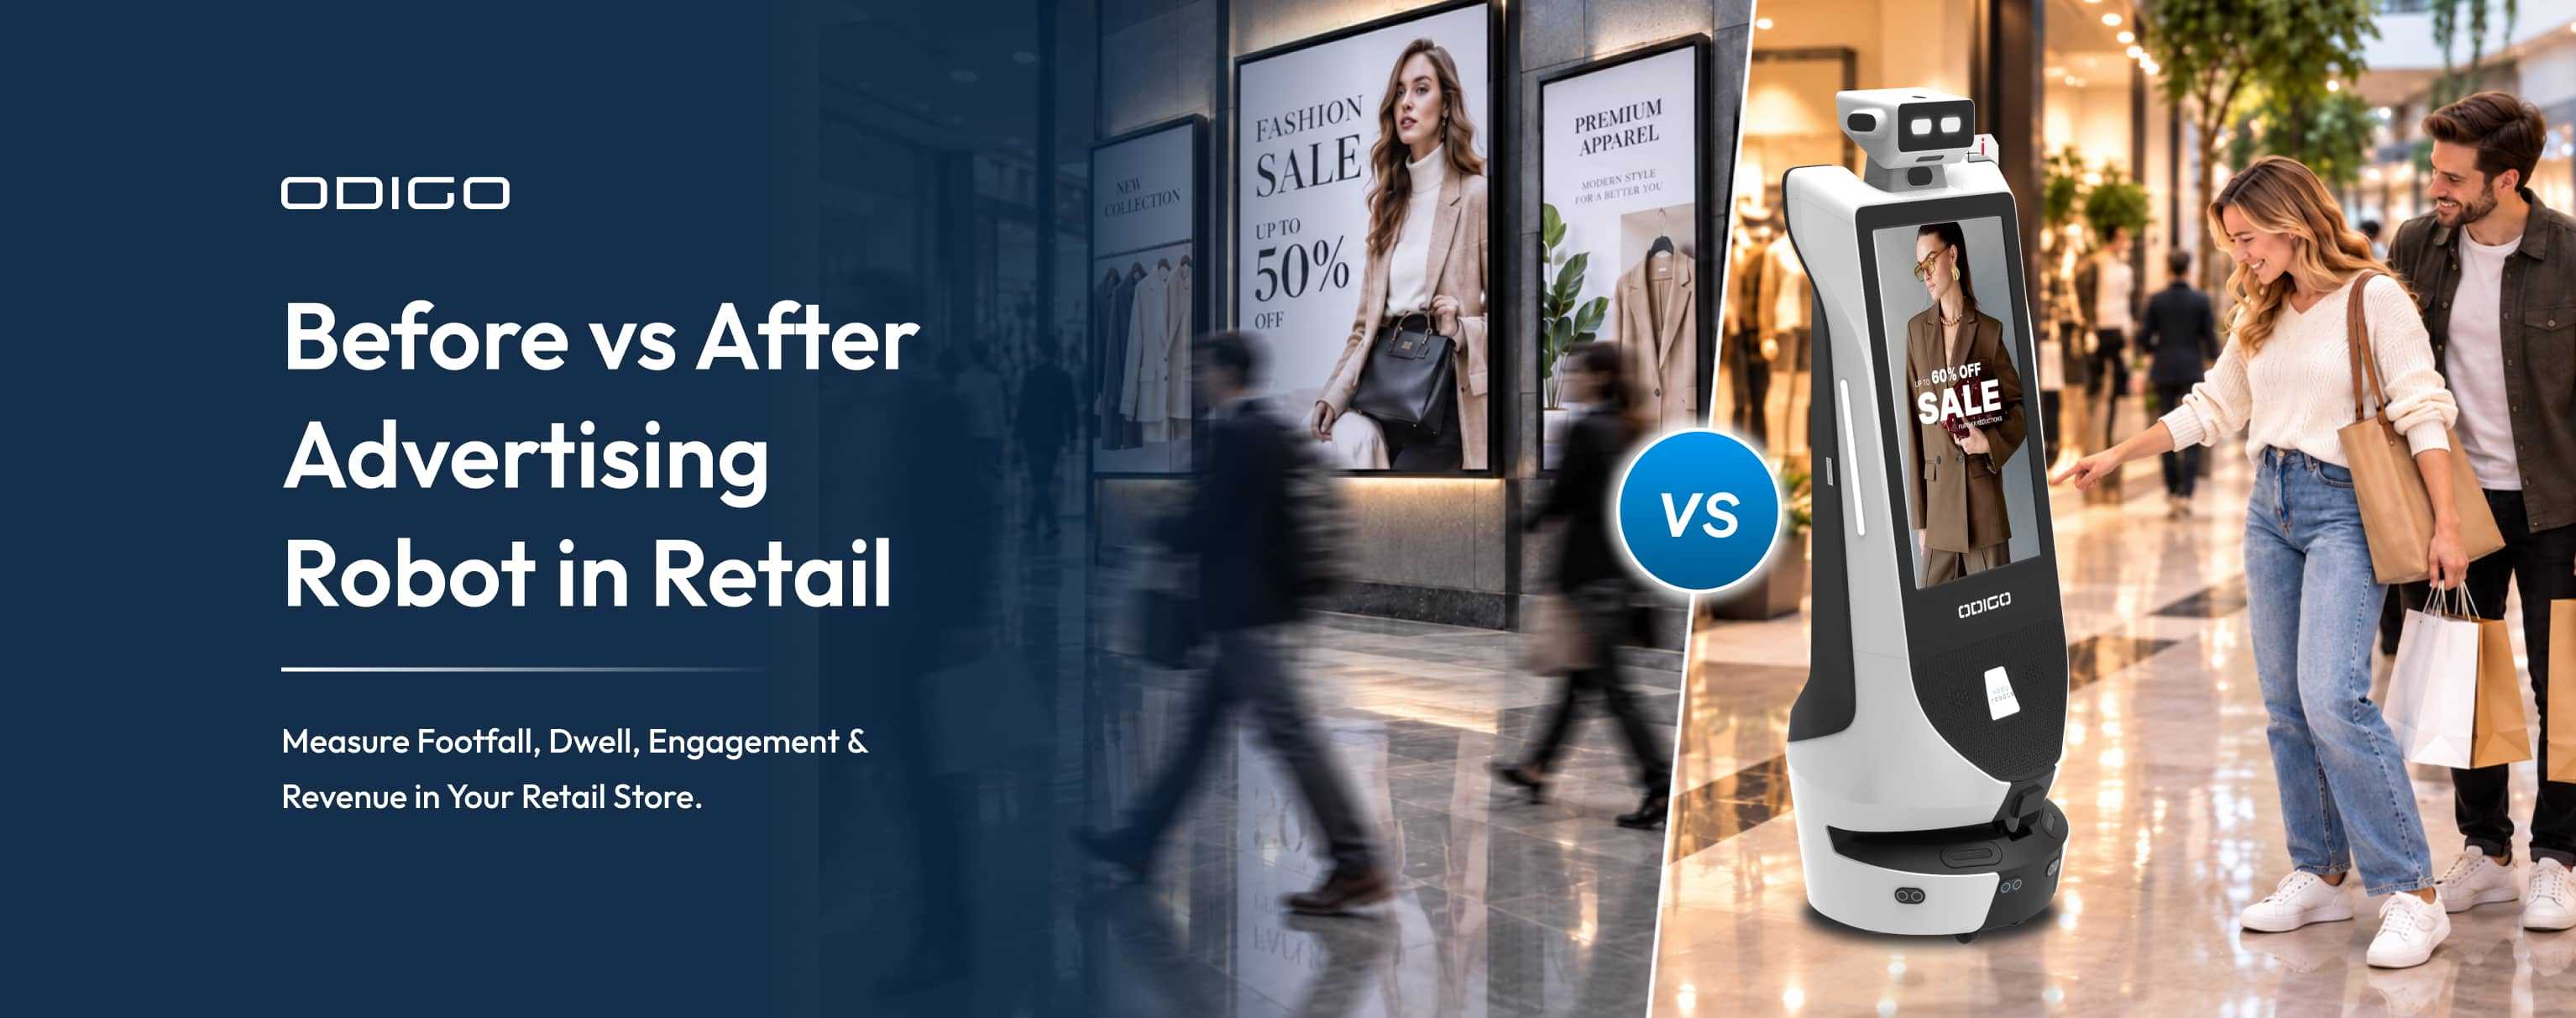

Quick Summary: A before vs after advertising robot in retail comparison only works when you set the baseline, target zones, and control stores before launch. This guide gives retailers a measurement framework, applies it to Odigo’s 61-day LuLu Mall Thiruvananthapuram deployment, and shows how to turn interactions, navigation requests, and ad plays into revenue evidence and sellable retail media inventory.
Key Takeaways
- Set a clear baseline before you deploy the advertising robot in retail.
- Track engagement and navigation through robot analytics, store traffic through footfall measurements, and sales impact through POS (point-of-sale) data and control-store comparisons.
- Compare equivalent periods and store conditions before and after deployment.
- Use comparable control stores to estimate the impact attributable to the advertising robot deployment.
- Odigo recorded 313,875 ad plays during its 61-day deployment at LuLu Mall.
- The deployment recorded 47,350 shopper interactions during the same period.
- Odigo recorded 6,050 navigation requests, with a reported conversion rate of 12.8%. Define the conversion action and calculation basis in the case study.
- Weekend shopper interactions were 2.8× higher than weekday interactions.
- Turn robot activity into measurable retail media inventory.
- Prove revenue impact with footfall, POS, and control data.
- Measure the clear difference after the deployment of advertising robots in retail and come up with creative campaigns.
An advertising robot can deliver thousands of ad plays in a supermarket without proving that the investment improved store performance. Retailers need to distinguish advertising delivery from shopper engagement and measurable commercial outcomes before committing to a wider rollout.
A before vs after robot in supermarket evaluation should go beyond counting interactions. A useful assessment compares performance against a defined baseline, accounts for promotions and seasonal traffic, and uses comparable control stores where possible. Robot analytics can reveal advertising activity and shopper responses, while footfall measurements and point-of-sale (POS) data help assess changes in store traffic and sales. With US in-store retail media ad spending forecast to climb 33.1% in 2026 by eMarketer, demonstrating the value of these investments is becoming increasingly important.
This guide introduces a practical retail robot impact scorecard to help supermarket operators and retail media teams evaluate deployment performance, identify evidence gaps, and set clear criteria for expanding or adjusting a pilot.
The goal is to connect robot activity with defensible business decisions and more accountable retail media planning. You can start by reading our guide to understand “what is an advertising robot”.
What Should Retailers Measure Before Deploying an Advertising Robot?
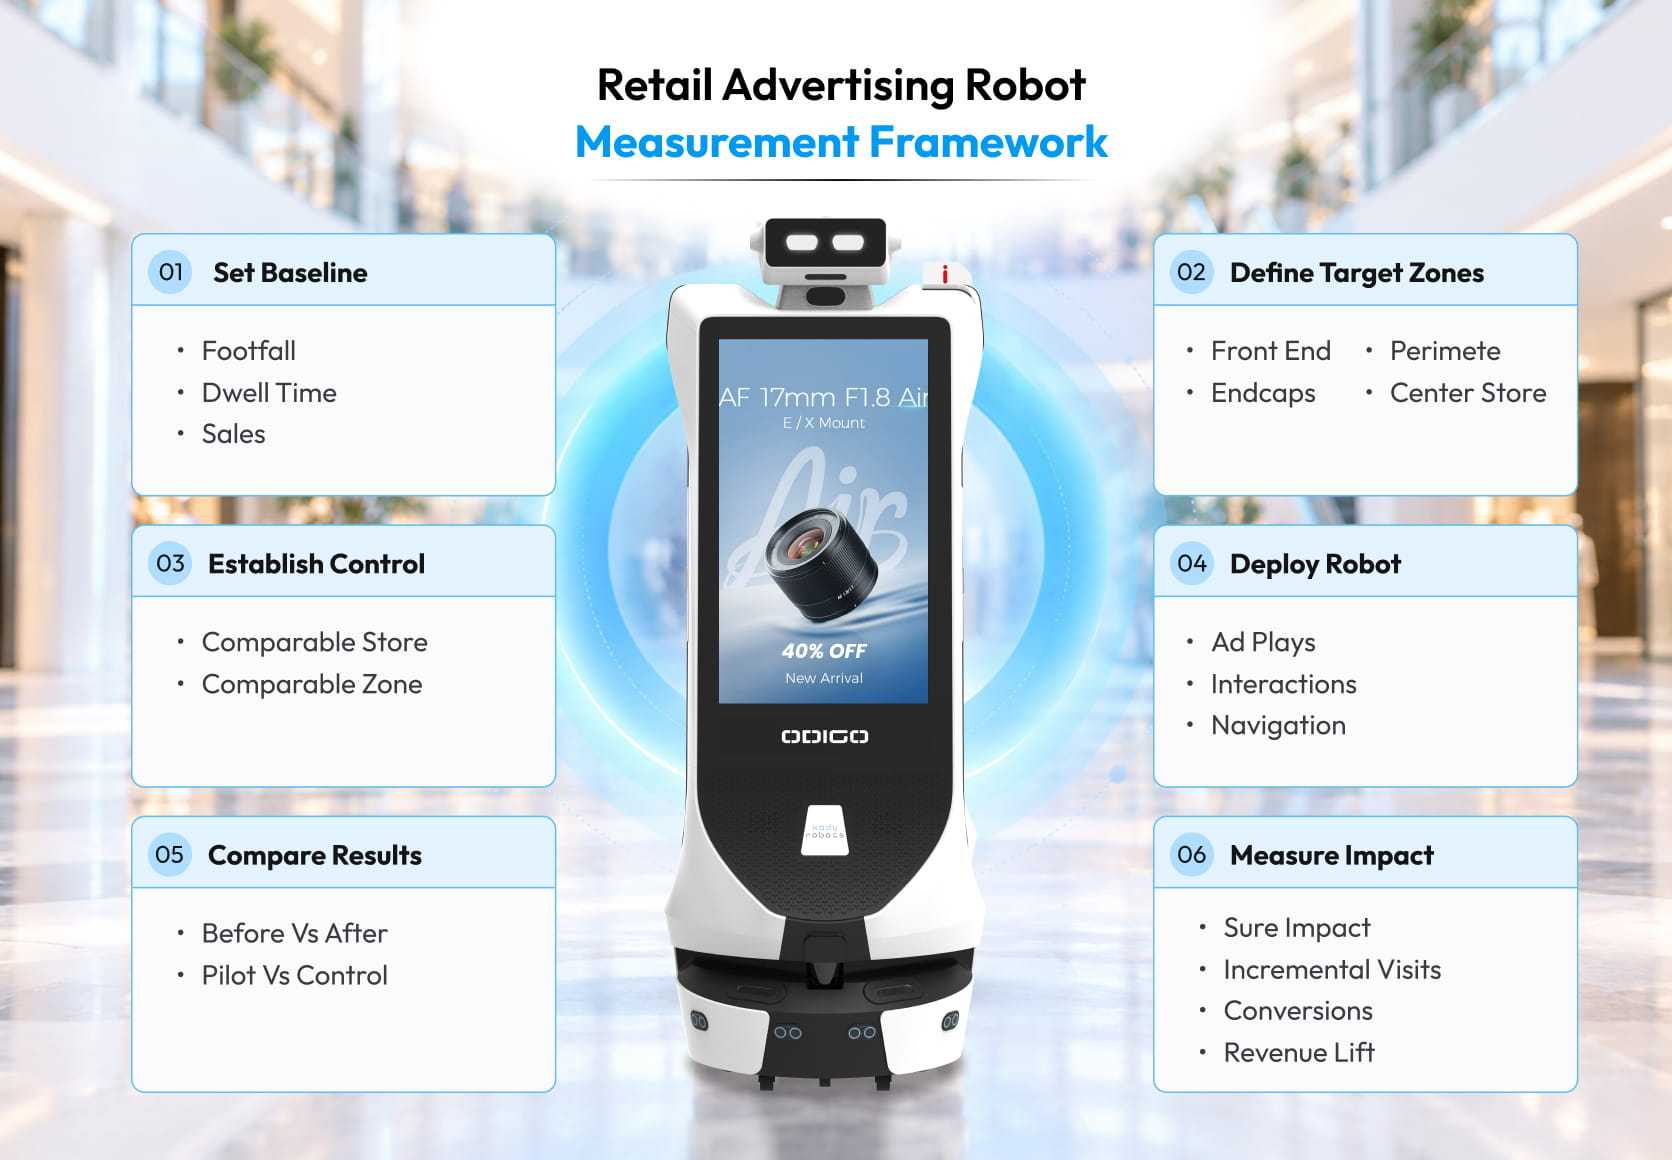
Measurement starts before an advertising robot enters the store, because a skipped baseline cannot be rebuilt, and the advertising robot impact on retail stores you report in month three depends on week-zero data.
Define the Business Objectives
Business objectives are the specific results you want to achieve with an advertising robot. Start by narrowing your focus to one or two priorities, such as increasing shopper engagement, improving product discovery, directing traffic to selected store zones, or expanding ad exposure.
For example, if you want to promote a new product, set product discovery and visits to the product’s store zone as your primary objectives. Clear objectives help you choose relevant KPIs and measure whether your pilot delivers the intended results.
Select the KPIs
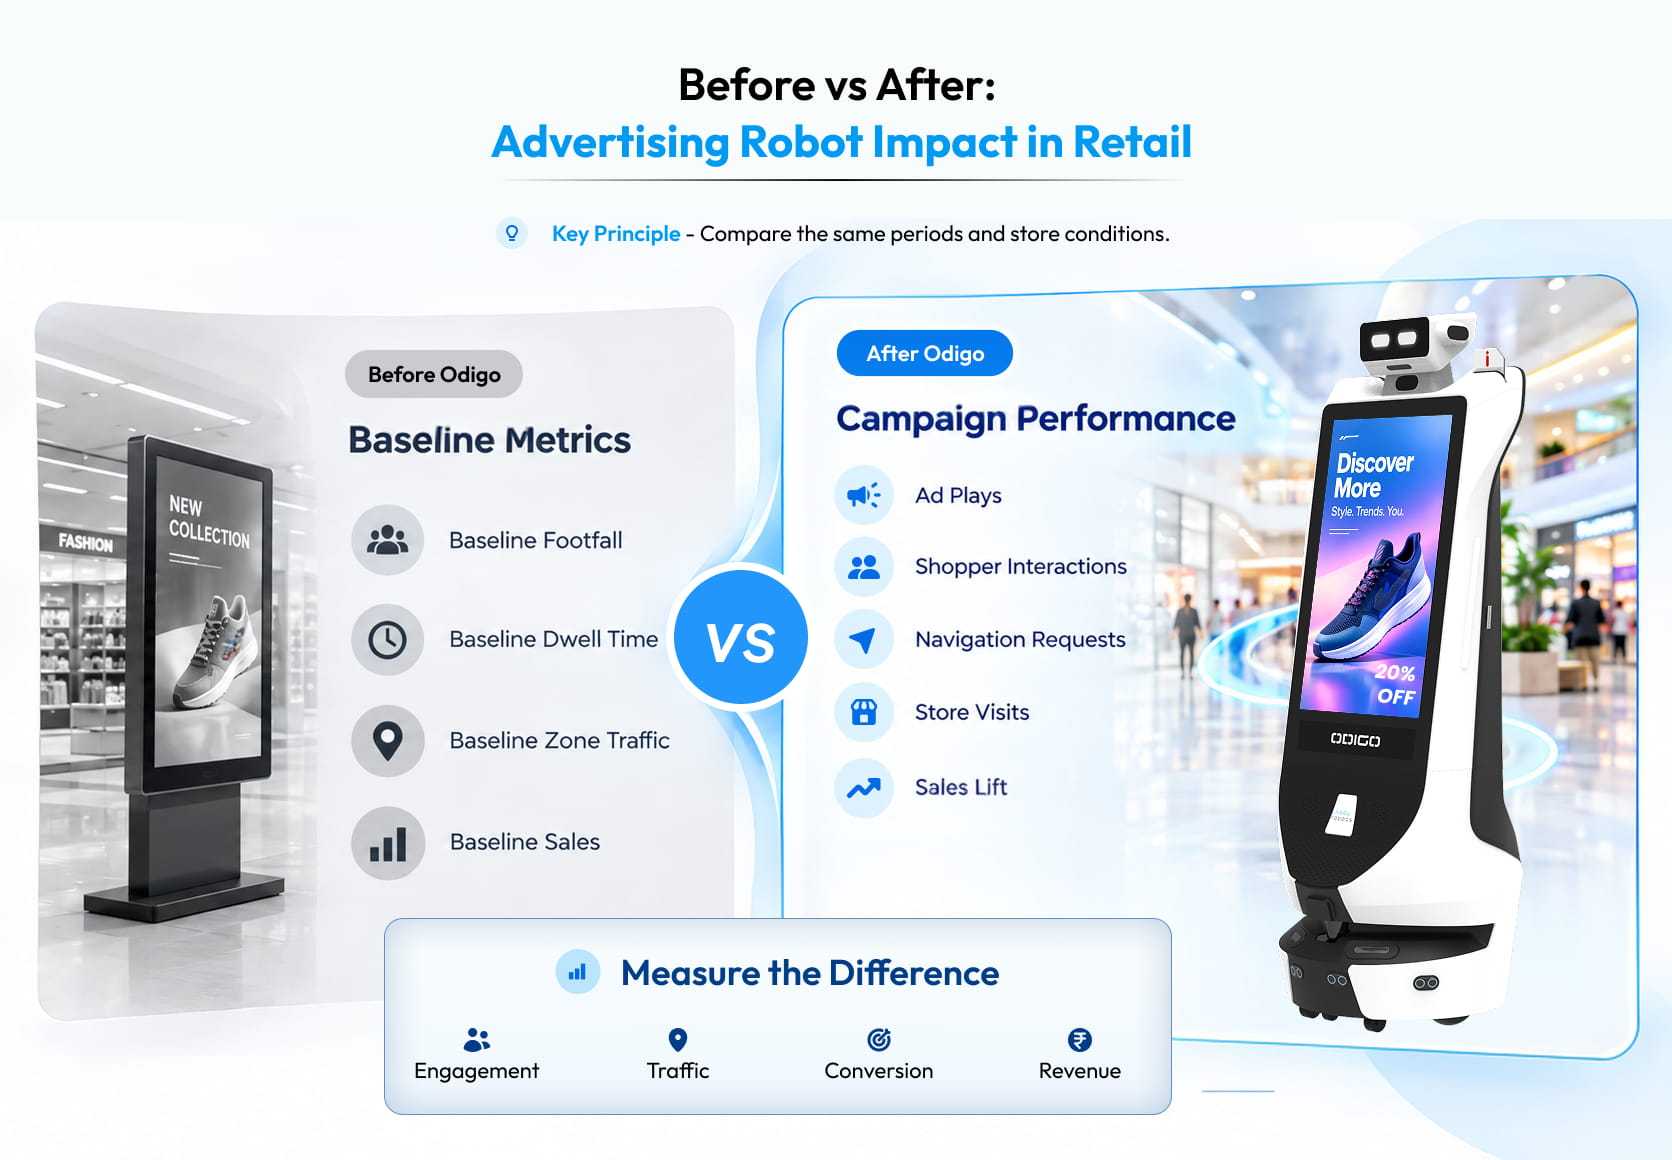
Group your key performance indicators (KPIs) into traffic (footfall, dwell time, shopper movement), campaign (exposure, interactions, navigation requests), and outcome (store visits, conversions, revenue). Footfall, dwell, and sales come from your own counters and point of sale (POS) data.
Set the Before vs After Advertising Robot in Retail Measurement Period
Capture several weeks of baseline data covering weekends, promotions, and day-parts, then run the pilot for a matching window. A payday weekend never behaves like a mid-month Tuesday.
Define Target Zones
Name the zones where you expect value: front end, endcaps, center store aisles, perimeter fresh departments, and underperforming areas. Check physical limits too. Odigo built by Kody Robots works on flat, indoor, ambient-temperature floors with aisles at least 1.3 meters (about 4.3 feet) wide, so chilled and freezer sections sit outside the pilot.
Establish Control Locations
Choose comparable zones or stores without an advertising robot to separate the pilot’s effect from wider traffic shifts. A control answers one question: would this have happened anyway?
What Should a Successful Advertising Robot Pilot Deliver?
Success is not a screen that a lot of ads played. A successful before vs after advertising robot in retail pilot delivers across six outcome areas, each with its own measure.
| Outcome area | What to measure |
| Engagement | Interactions, interaction rate, repeat interactions, engagement by zone and day-part |
| Navigation | Navigation requests, completions, destination zones |
| Campaign delivery | Ad plays, exposure opportunities, frequency by zone and day-part |
| Zone performance | Footfall, dwell time, movement, traffic distribution |
| Operational performance | Operating hours, coverage, charging interruptions, route completion |
| Revenue and transactions | Store visits, transactions, sales lift, incremental revenue |
Skip a row and the robot in retail impact story turns into a guess.
How Do You Run a Before vs After Advertising Robot in Retail Comparison?
Run the comparison in five moves and treat each as a check on the one before it.
Compare the Same Measurement Periods
Match pilot weeks to baseline weeks by length, weekday mix, and day-part, so you never weigh a Saturday against a Tuesday.
Compare Like-for-Like Store Conditions
Adjust for promotions, holidays, store events, seasonal foot traffic, and operating hours. A reset that moves a category changes shopper movement on its own.
Separate Traffic Changes from Campaign Impact
More interactions can simply mean more shoppers. Divide interactions by foot traffic in the same zone and period to see whether the rate changed.
Compare Against Control Locations
Run the same math on a comparable zone or store without an advertising robot, then report the gap between the two trends.
Measure Incremental Outcomes
Move past activity counts toward incremental visits, interactions, conversions, and sales, the extra results the pilot alone produced.
| What changes | Before Odigo | After Odigo (Advertising Robot) | Impact for you |
| Ad inventory | Fixed screens sell fixed locations | Odigo carries ads through store zones. At LuLu Mall Thiruvananthapuram it played 313,875 ads in 61 days, roughly 5,100 a day | A new layer of retail media inventory you can sell by zone and day-part |
| Shopper engagement | Passive signage shows exposure only, so you cannot tell who responded | Shoppers respond on the screen. LuLu Mall Thiruvananthapuram logged 47,350 interactions | Engagement rate, a stronger signal than impressions |
| Product finding | Shoppers ask a store associate or give up | Odigo escorts shoppers to a destination. LuLu Mall logged 6,050 navigation requests, 12.8% of interactions | Shopper intent by destination, with associates free for shelf availability and customer-facing work |
| Day and time patterns | One blended average for the whole week | Results split by day and time. LuLu Mall Thiruvananthapuram weekends delivered an interaction rate 2.8x higher than weekdays | Creative and inventory pricing planned by day-part |
| Zone performance | Store-level traffic only | Results by zone, such as ground floor vs first floor | Placement decisions, and a clear case for where a second unit would pay off |
| Advertiser reporting | Opportunity-to-see estimates | Ad plays, interactions, navigation actions, and campaign timing for each campaign | Campaign reports an advertiser can audit |
| Revenue evidence | Sales reported at store level, with no link to in-store media | Measurable with a baseline, control locations, and your POS data | Incremental lift you can defend, though no advertising robot automatically grows revenue |
| Daily store routine | No added routine | Basic associate training, plus a short daily check (battery at 60% or above before peak hours, sensors wiped) | A light routine, with Kody Robots providing software support virtually at all times |
The table above is a clear distinction of how retail would look before and after the deployment of an advertising robot in retail.
What Do Retail Robot Analytics Tell a Retailer?
Metrics from a robot assistant pilot answer one commercial question and leave another open. Here’s what each metric tells you and what it leaves out.
| Metric | What it tells you | What it does not tell you |
| Footfall and shopper traffic | How many shoppers pass through a zone | Whether an advertising robot drew them |
| Dwell time and movement | Where shoppers slow down or reroute | Why they slowed |
| Ad plays and impressions | How much ad inventory ran | Whether anyone paid attention |
| Shopper interactions | Active engagement, stronger than exposure | Whether the shopper bought |
| Navigation requests | Intent to reach a department or product | Whether the shopper arrived |
| Store visits and conversions | Movement from engagement toward outcomes | Which exposure caused the visit |
| Revenue and sales lift | The highest-value layer, tied to basket value and conversion rate | Causation, without a control group |
All of these metrics will help you understand the blinders and gives clear insight to the retailers. These metrics help retailers understand shopper behavior, engagement, and potential sales impact.
However, engagement alone does not guarantee purchases or prove that a robot drove conversions. By combining analytics with controlled experiments, retailers can measure the true commercial value of advertising robots.

What Can a Real Odigo Deployment Tell Retailers?
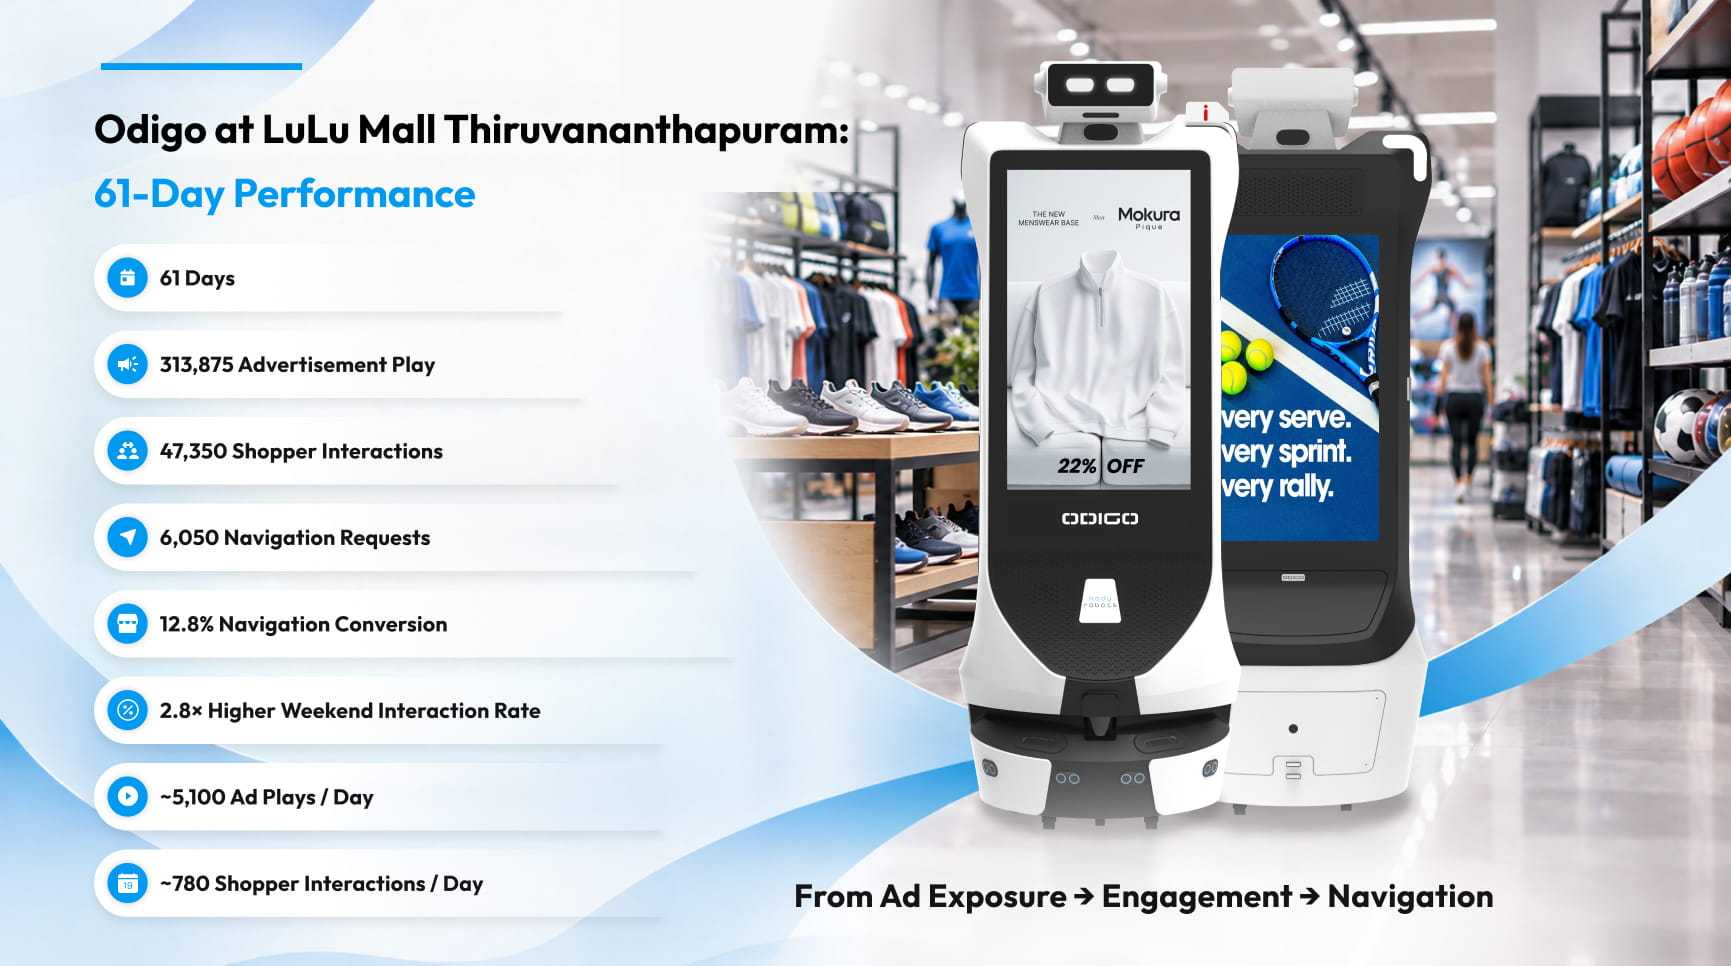
Here is how the before vs after advertising robot in retail framework applies to a real deployment. Odigo, the autonomous service and advertising robot from Kody Robots, navigates active floors with LiDAR and a depth camera, and it ran at LuLu Mall Thiruvananthapuram for 61 days. Because this retail robot case study comes from a mall, not a supermarket, treat the numbers as a worked example of the method, not a forecast for your store.
Campaign Delivery: 313,875 Ads Played Across 61 Days
That works out to roughly 5,100 ad plays a day, a delivery number a media team can report against.
Shopper Engagement: 47,350 Interactions
Shoppers interacted with Odigo robot assistant roughly 780 times a day. Interactions outweigh plays, because a play proves an ad ran while an interaction proves a shopper responded.
Navigation: 6,050 Requests and 12.8% Navigation Conversion
Shoppers asked Odigo to guide them 6,050 times, and 12.8% of interactions became navigation requests. In a supermarket, watch this conversion closely, because a shopper asking where an item sits is close to a basket.
Weekend Performance: 2.8x Higher Interaction Rate
Weekends delivered an interaction rate 2.8x higher than weekdays, so a blended average would have buried the best engagement windows.
Ground Floor vs. First Floor Performance
The LuLu Mall Thiruvananthapuram results break out by ground floor and first floor, the model for zone-level measurement. A supermarket can split the same way across the front end, center store, and perimeter.
What Does the Deployment Data Reveal About Shopper Behavior?
Read the LuLu Mall Thiruvananthapuram numbers as behavior, not a scoreboard. A before vs after robot in supermarket test should look for the same five patterns.
High-Traffic Zones Can Maximize Awareness
Heavy foot traffic gives an advertising robot the most chances to play an ad, so those zones suit awareness campaigns.
High-Intent Zones Can Drive Navigation
Where shoppers hunt for a specific item, expect navigation requests to climb, so tie category campaigns to those zones.
Weekend Traffic Can Create Stronger Engagement Windows
With a 2.8x weekend interaction rate in the LuLu data, weekends deserve your most relevant creative and premium inventory.
Day-Part Performance Can Shape Campaign Planning
Shoppers at 8 a.m. differ from shoppers at 6 p.m., so schedule creative by day-part, not one loop all day.
Zone-Level Data Can Improve Placement
Zone results show where to station Odigo, where a second unit would pay off, and which areas to drop.
How Can Retailers Connect Advertising Robot Activity to Revenue?
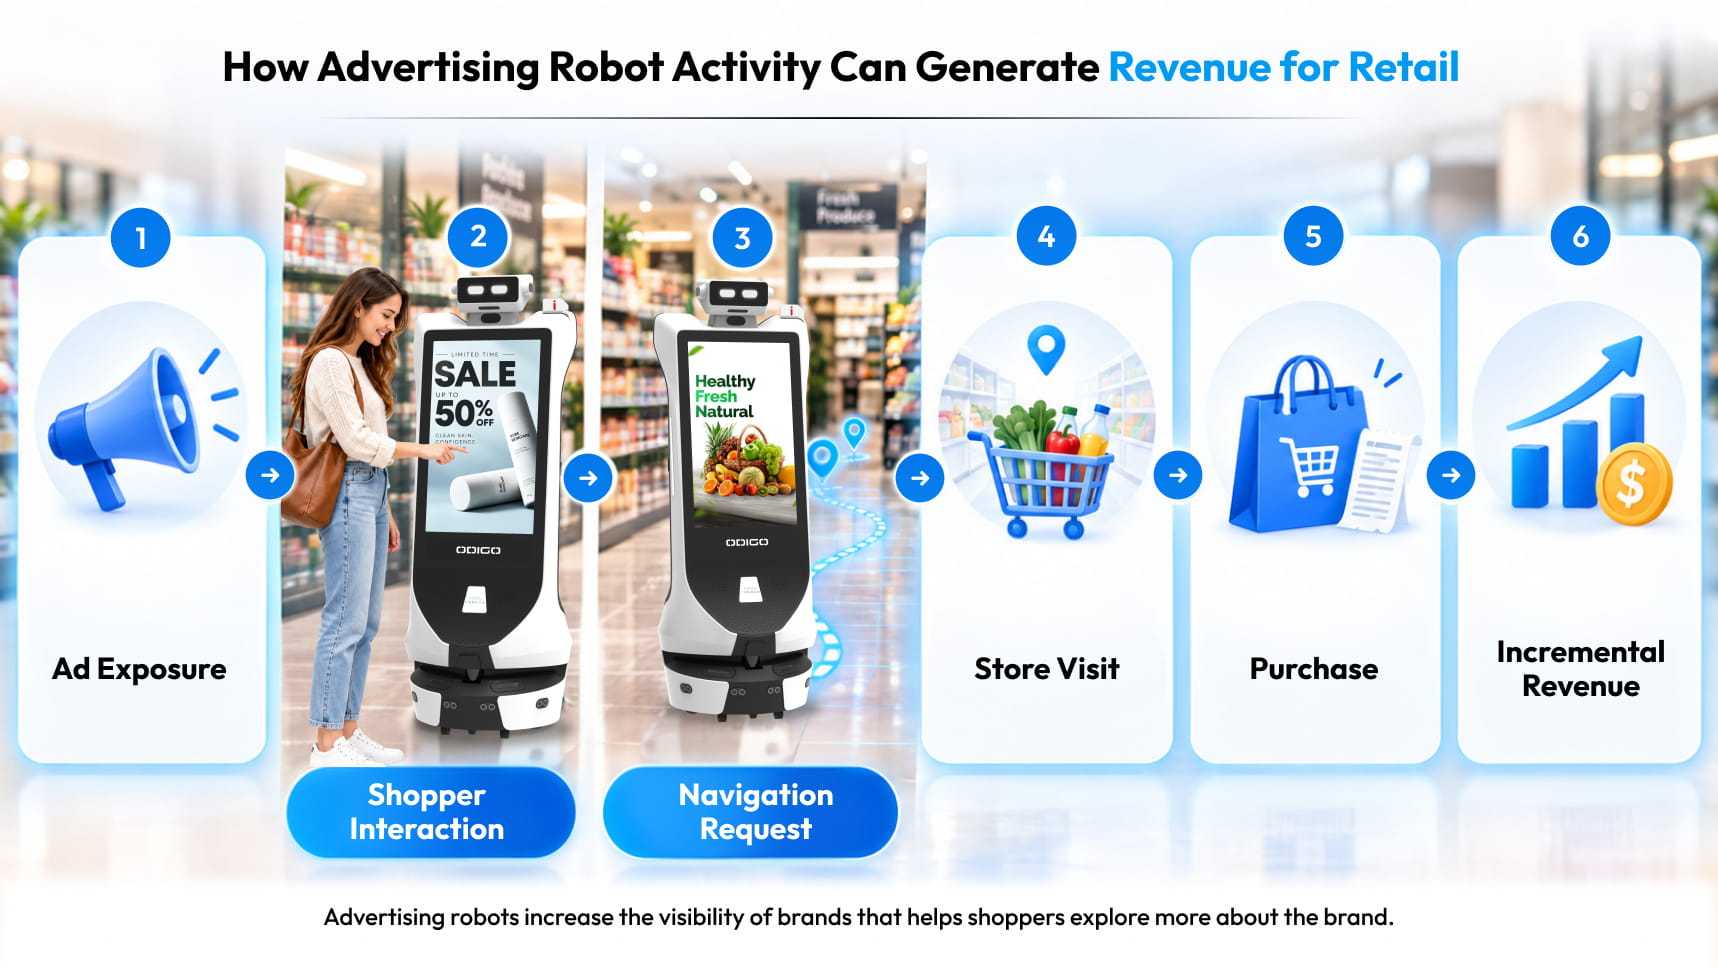
Connecting advertising robot activity to revenue requires evidence at each measurement stage. A before vs after advertising robot in retail comparison can reveal changes in performance, but attributing sales impact requires data linking campaign activity with shopper behavior and purchase records.
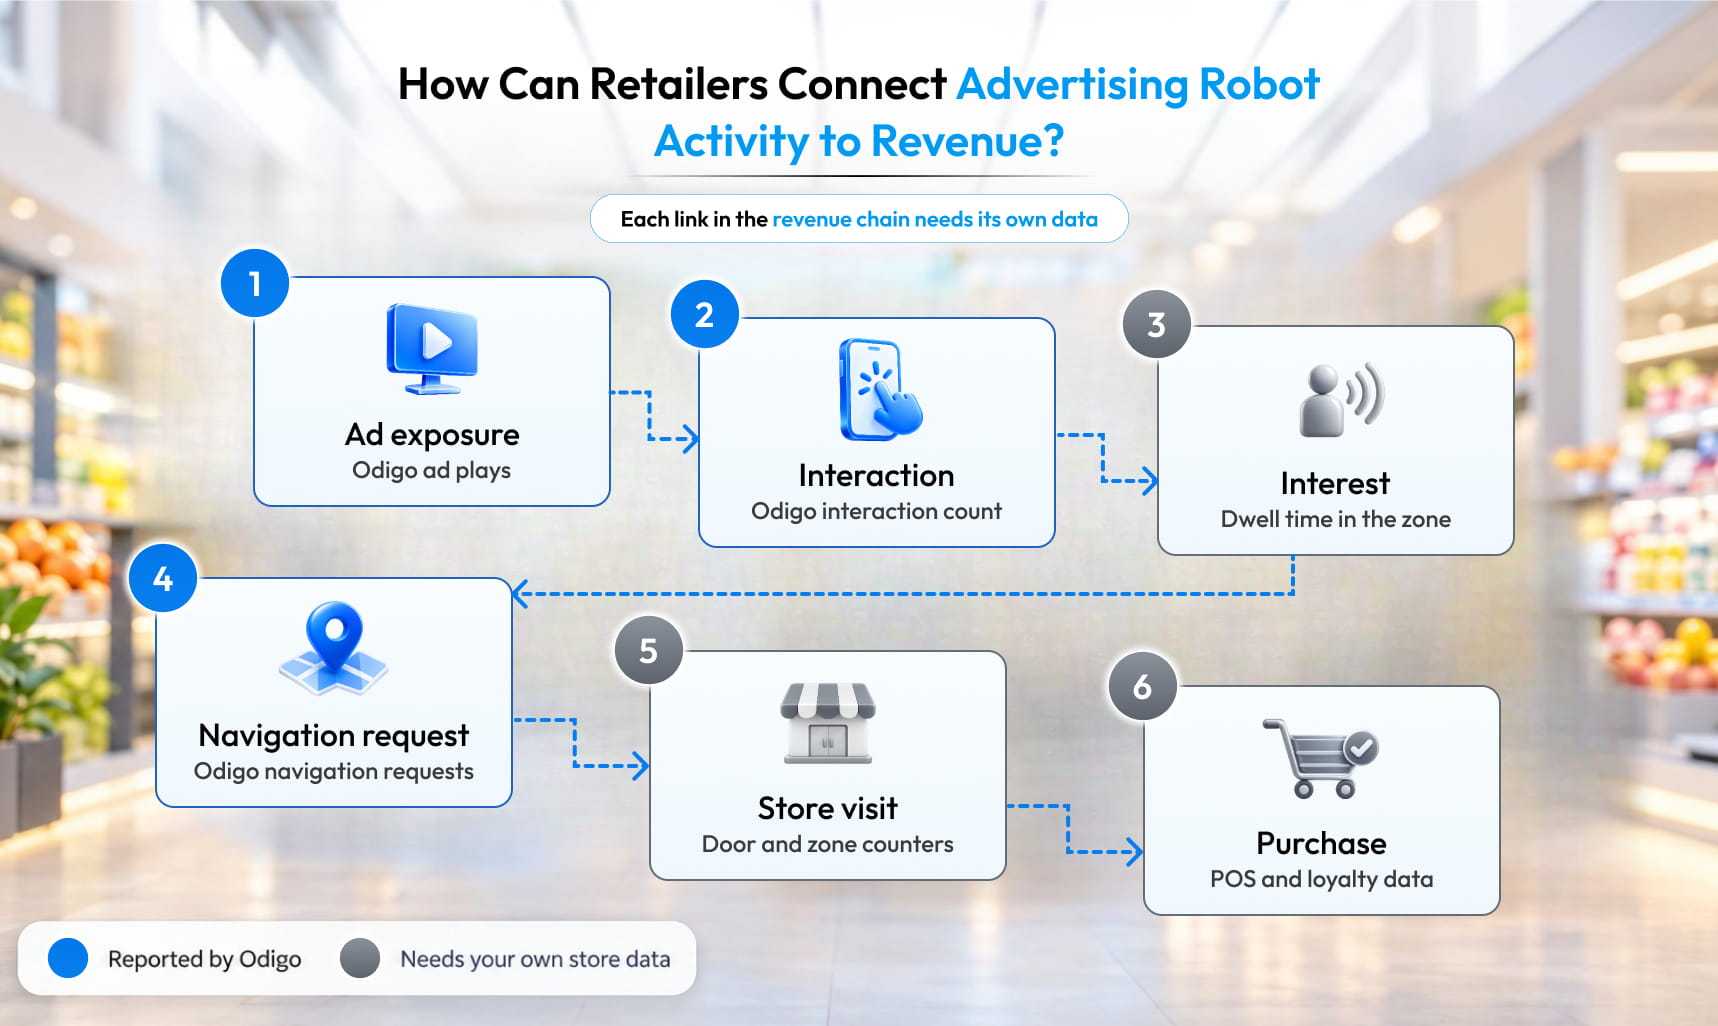
revenue chain · 6 links, 3 reported by Odigo
Odigo analytics can provide data on supported advertising and interaction metrics. Retailers can combine those records with suitable footfall and POS data to assess shopper response and evaluate potential business impact.
From Ad Exposure to Shopper Action
Track ad plays, recorded interactions, navigation requests, and visits to the promoted zone as separate metrics. Define each event clearly and measure how often shoppers progress between observable stages. Treat interest as a measurable action, such as a product inquiry or navigation request, rather than an assumed response.
From Navigation to Store Visits
A navigation request records a shopper’s request for directions to a destination, but does not confirm arrival. Pair navigation logs with suitable zone-level counters to assess whether traffic reached the intended area. Treat the result as a traffic measurement, not proof of a purchase or revenue impact.
From Store Visits to Purchase
Campaign-level purchase attribution requires POS, loyalty, or basket data linked to the relevant campaign period and, where possible, the promoted products. Without a reliable connection between campaign activity and purchase data, retailers can report overall sales but cannot confidently attribute sales changes to the advertising robot.
Measuring Incremental Sales Before vs After Advertising Robot in Retail
Establish baseline sales for the pilot store and a comparable control location. Compare sales over equivalent periods, accounting for promotions, pricing, and other factors that may influence demand. Use available store-level or product-level sales data alongside shopper activity to estimate incremental sales. The results can indicate potential sales impact, but the strength of the conclusion depends on the comparison design and data quality. Robot activity alone does not prove revenue growth.
How Can an Advertising Robot Become a Retail Media Inventory?
For a retail media team, the question shifts from “did shoppers engage?” to “what can I sell, and how do I report it?”
Turning Robot Movement into Advertising Inventory
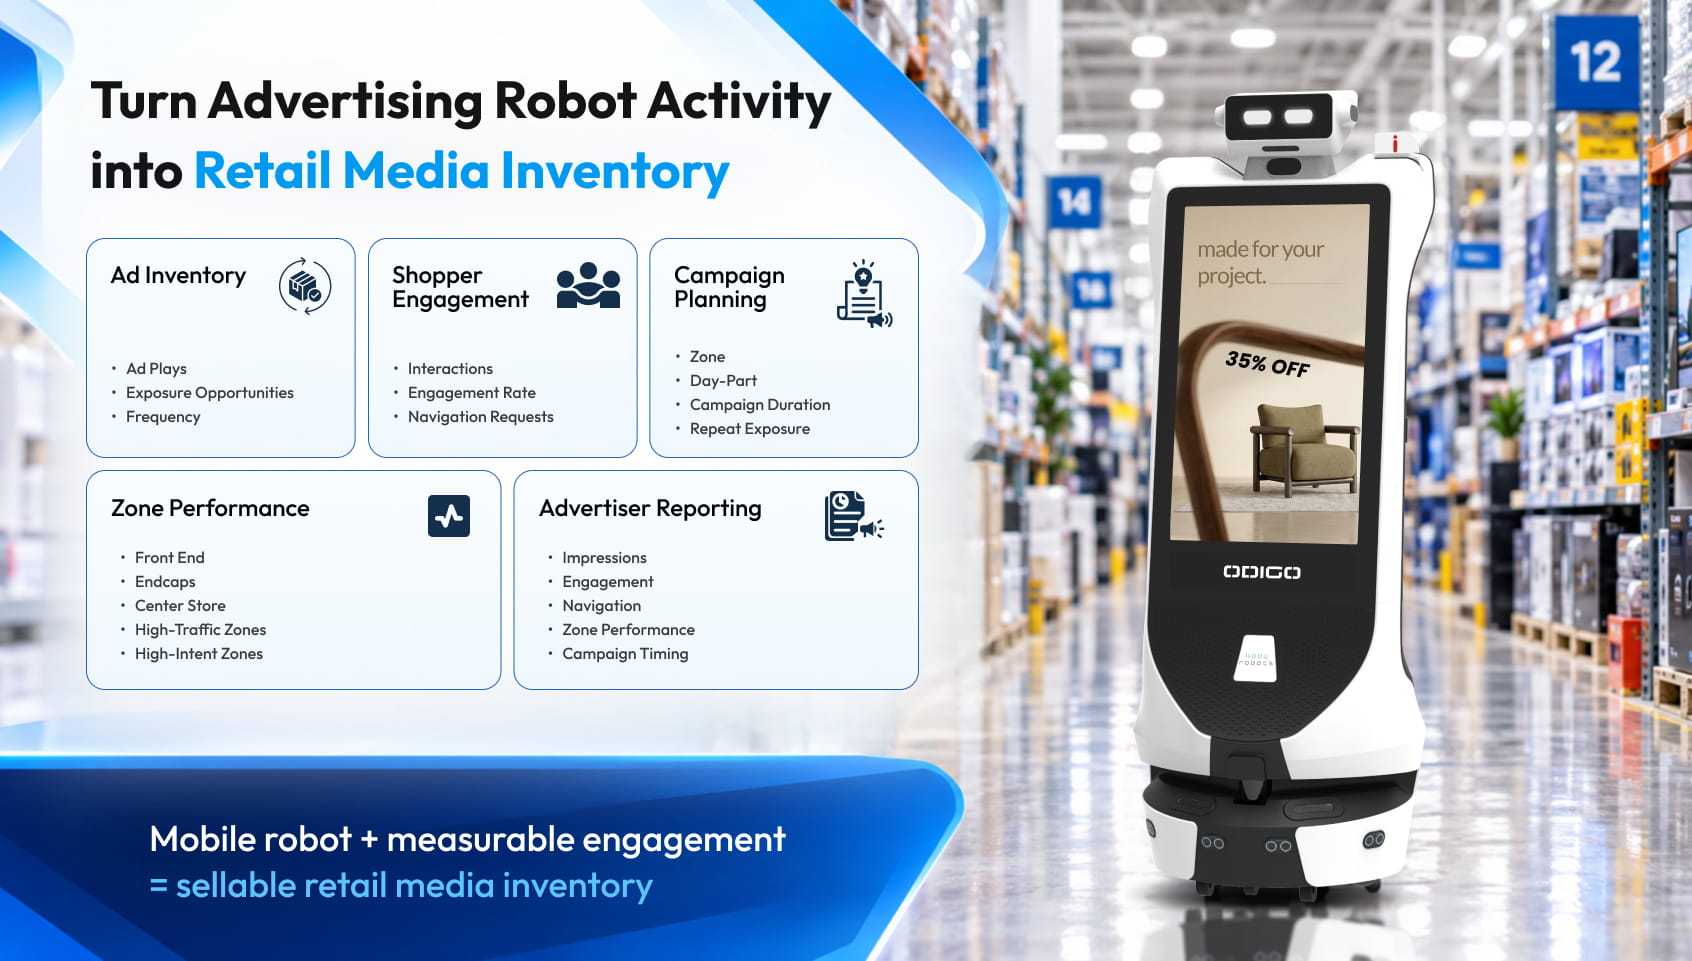
A fixed screen sells one location. A mobile placement sells store zones, campaign duration, day-parts, and repeat exposure, because Odigo carries the ad to where shoppers already are.
Connecting Mobile Inventory with Retail Media Inventory
Treat Odigo as one more physical surface in your retail media network (RMN), beside digital signage, endcap screens, and other in-store media, adding a new layer of retail media inventory on one rate card.
Using Shopper Analytics to Build Advertising Packages
Ad plays, interactions, and zone results form the reporting backbone for packages priced by zone and day-part, with cost per thousand impressions (CPM) as the benchmark. That makes retail advertising in the aisle reportable on engagement, not only exposure.
What Advertisers Can Measure
Advertisers can track ad plays, interactions, engagement rate, zone performance, navigation actions, and campaign timing. Closed-loop measurement, which ties exposure to purchase, comes later and needs first-party data.
When Does a Before vs After Advertising Robot in Retail Comparison Make Commercial Sense?
Your store is a good candidate when most of the conditions below hold, and a supermarket before and after advertising robot test becomes straightforward to run.
| Condition | What to confirm |
| High and diverse shopper traffic | Enough foot traffic across zones for volume |
| Navigation and discovery matter | A large-format store where shoppers struggle to find items |
| Retail media is a priority | An RMN, or a plan to sell in-store media to brands |
| Measurable engagement matters | Interactions and navigation requests reported by zone |
| Defined zones for activation | Endcaps, front end, and center store aisles mapped for campaigns |
| A pilot you can measure | Baseline data, control locations, and a defined window |
Large-format supermarkets often meet the navigation condition first, since every unanswered question risks a lost basket, and Odigo escorts a shopper to aisle 14 without pulling a store associate off shelf availability. Treat any claim about the advertising robot effect on supermarket footfall as unproven until your own counters confirm it.
When Might Another Format Be a Better Fit?
A framework that recommends only one format deserves skepticism. The guide to Advertising robot vs interactive kiosk vs digital signage compares all three technologies for you.
Mobile Robot vs. Fixed Digital Signage
Fixed signage wins when the audience is predictable and the message belongs to one location, since a screen is simpler to install and needs no floor mapping. Choose mobility when reach across zones matters.
Mobile Robot vs. Interactive Kiosk
A kiosk waits for shoppers who already want help. A Retail Store Robot such as Odigo reaches shoppers who have not asked yet and escorts them to a destination.
When Mobility Adds Measurable Value
Ask whether mobility adds reach, zone coverage, engagement, navigation, ad inventory, or measurable outcomes. If none improve, novelty is the only gain.
If you want to grasp the wider concept of robot assistants, you can read Kody robots Robot Assistant Comparison guide. The guide helps you understand how to differentiate various robot assistants and how they work in your retail environment.
What Can Make an Advertising Robot Pilot Underperform?
Weak results usually trace to deployment choices rather than hardware, so a before vs after advertising robot in retail pilot that disappoints deserves a hard look at placement first. We suggest reading why retail robots fail before you plan one.
Poor Store Placement
An advertising robot parked in a dead-end aisle wastes ad inventory, because shoppers never meet it.
Weak Campaign Relevance
Generic creative earns glances, not interactions, so match each campaign to its zone.
Limited Shopper Interaction
When plays rise but interactions stall, revisit the on-screen prompts, speed, and volume.
Poorly Defined Target Zones
Without named zones, you cannot compare performance, so map endcaps, aisles, and the front end before launch.
Missing Measurement or Attribution
No baseline and no control group means no credible result, and a before vs after robot in supermarket claim without either carries no weight.
Operational Gaps That Affect Before vs After Advertising Robot in Retail Performance
Low battery, dirty LiDAR sensors, and blocked routes cost coverage. Odigo runs 10+ hours per charge, so associates should confirm 60% battery before peak hours, wipe the sensors daily, and set virtual walls around the backroom, receiving area, and freight corridors. Pallet-jack forks and decks below 25 cm (about 10 inches) can escape detection, so keep Odigo out of freight-stocking hours.
What Should Retailers Do After the Pilot?
A before vs after advertising robot in retail pilot ends with a decision, not a report.
Review Performance Against the Baseline
Compare every KPI with the baseline and control locations first.
Identify High-Performing Zones and Campaigns
Rank zones and campaigns by interactions, navigation requests, and incremental visits.
Optimize Placement and Campaign Scheduling
Move Odigo toward the zones that responded, and shift creative toward the day-parts that did.
Refine Retail Media Packages
Rebuild packages around the zones and day-parts that earned engagement.
Decide Whether to Expand, Modify, or Stop the Program
Set the thresholds before the pilot starts, then follow them, including when the answer is stop.
Build the Case for a Larger Rollout
Document your pilot as a retail robot case study of your own. Kody Robots takes a first store from order confirmation to a live, tested deployment in roughly 20 to 24 days, with virtual software support at all times and preventive maintenance every three weeks. The robot assistant deployment guide covers the rollout steps.
Measure the Change and the Deployment
Do not judge an advertising robot by whether it operated successfully. Judge it by whether the deployment created measurable shopper, campaign, and commercial value. Retailers get store performance and shopper outcomes they can defend to a CFO. Advertisers get inventory, exposure, engagement, and campaign results they can audit.
Every before vs after advertising robot in retail study ends the same way: the retailers that build the baseline first can prove the robot in retail impact and the advertising robot impact on retail stores, and everyone else argues from anecdotes. The question worth sitting with is whether your next in-store technology pilot would survive a control group.
Before vs After Advertising Robot in Retail – General FAQs
Find answers your confusion before vs after advertising robot in retail performance, shopper engagement, footfall, and revenue measurement.
1: What is the impact of an advertising robot in retail?
Odigo by Kody Robots at LuLu Mall Thiruvananthapuram produced 313,875 ad plays and 47,350 interactions in 61 days, while sales impact needs a baseline and controls. You retail can have better impact as well when the advertising robot for retail is deployed.
2: How do you measure the impact of an advertising robot?
Set objectives, KPIs, target zones, a baseline period, and control locations before launch, then compare results against both.
3: How do you compare before vs after advertising robot in retail performance?
Match periods and store conditions, then add control locations. A before vs after advertising robot in retail comparison only counts when it separates incremental results from ordinary traffic swings.
4: What should retailers measure before deploying an advertising robot?
Capture baseline footfall, dwell time, zone traffic, and sales for each target zone across weekends, promotions, and day-parts.
5: What Analytics Should Retailers Track Before vs After Advertising Robot in Retail Deployment?
Track ad plays, interactions, and navigation requests by zone and day-part, then pair them with your own footfall, dwell, and sales data.
6: What does a successful advertising robot pilot look like?
Measurable engagement, navigation, campaign delivery, zone performance, and incremental revenue against a baseline, not just a high count of ad plays.
7: Can an advertising robot increase retail footfall?
Possibly, but only a control comparison can show it. The LuLu Mall Thiruvananthapuram data measures interactions and navigation, not footfall lift.
8: How Does Shopper Dwell Time Change Before vs After Advertising Robot in Retail Deployment?
Compare dwell time in target zones before and after deployment, using baseline data and comparable control zones to assess whether changes are associated with the advertising robot.
9: How can retailers measure revenue from an advertising robot?
Tie POS or loyalty data to campaign windows, then subtract the sales movement in control locations to isolate incremental lift.
10: How can advertisers measure the performance of advertising robot campaigns?
Track ad plays, interactions, engagement rate, zone performance, navigation actions, and campaign timing for each campaign.