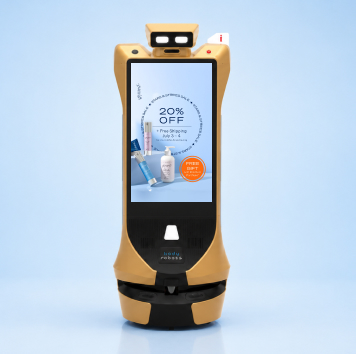
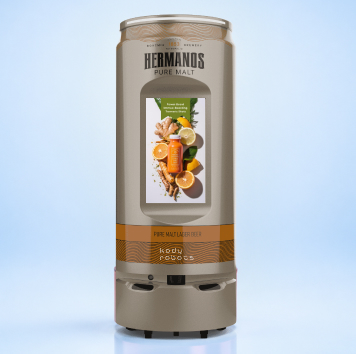
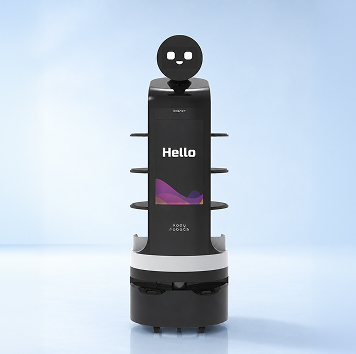
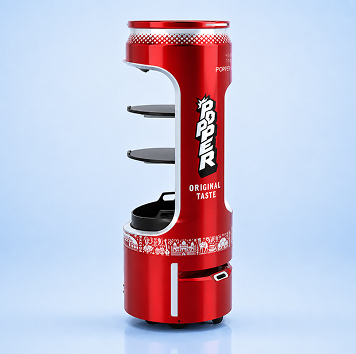


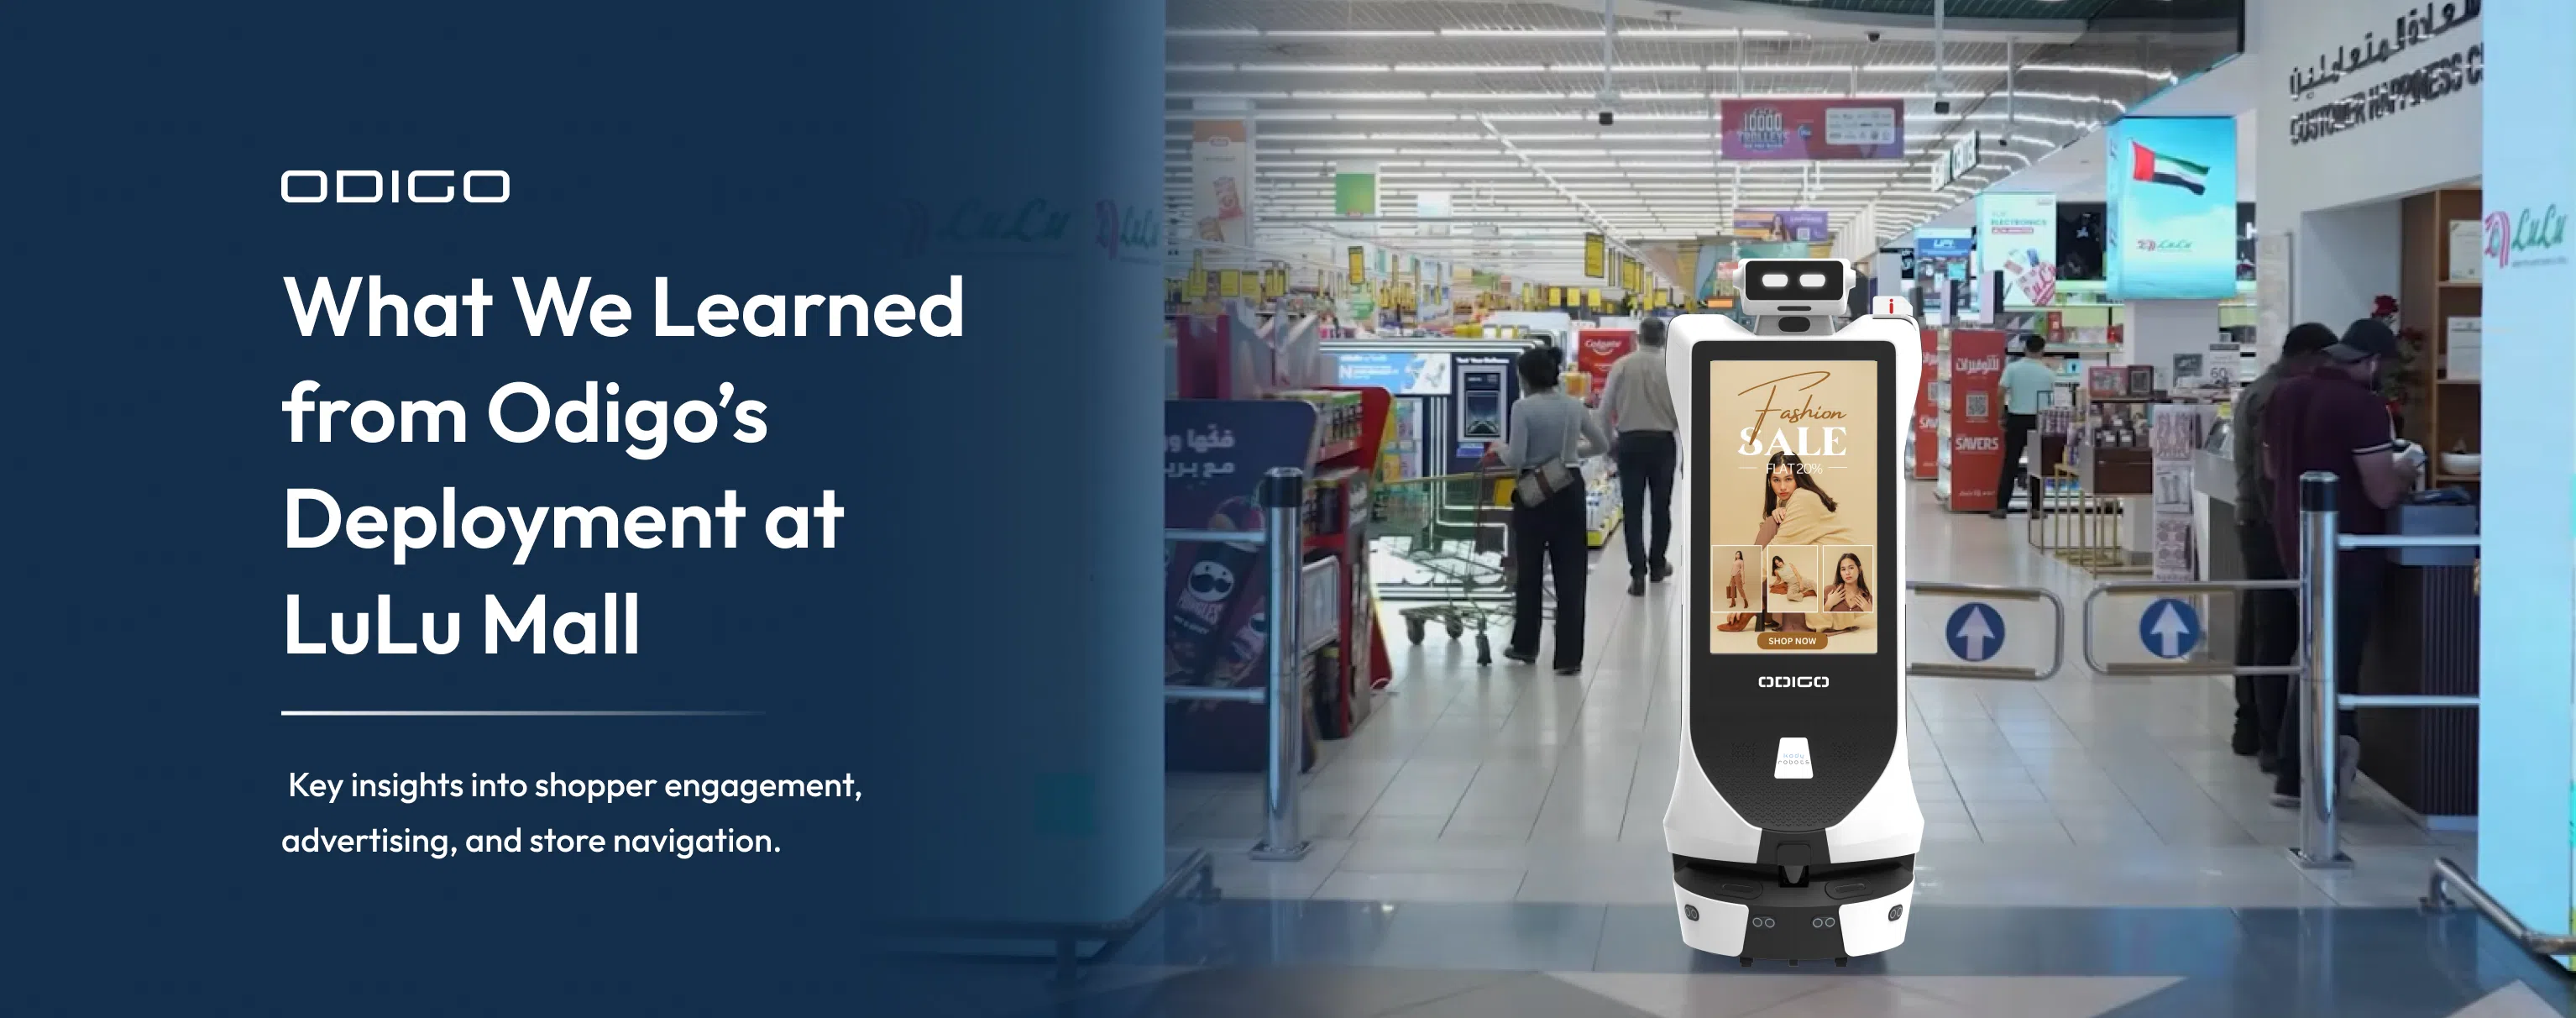

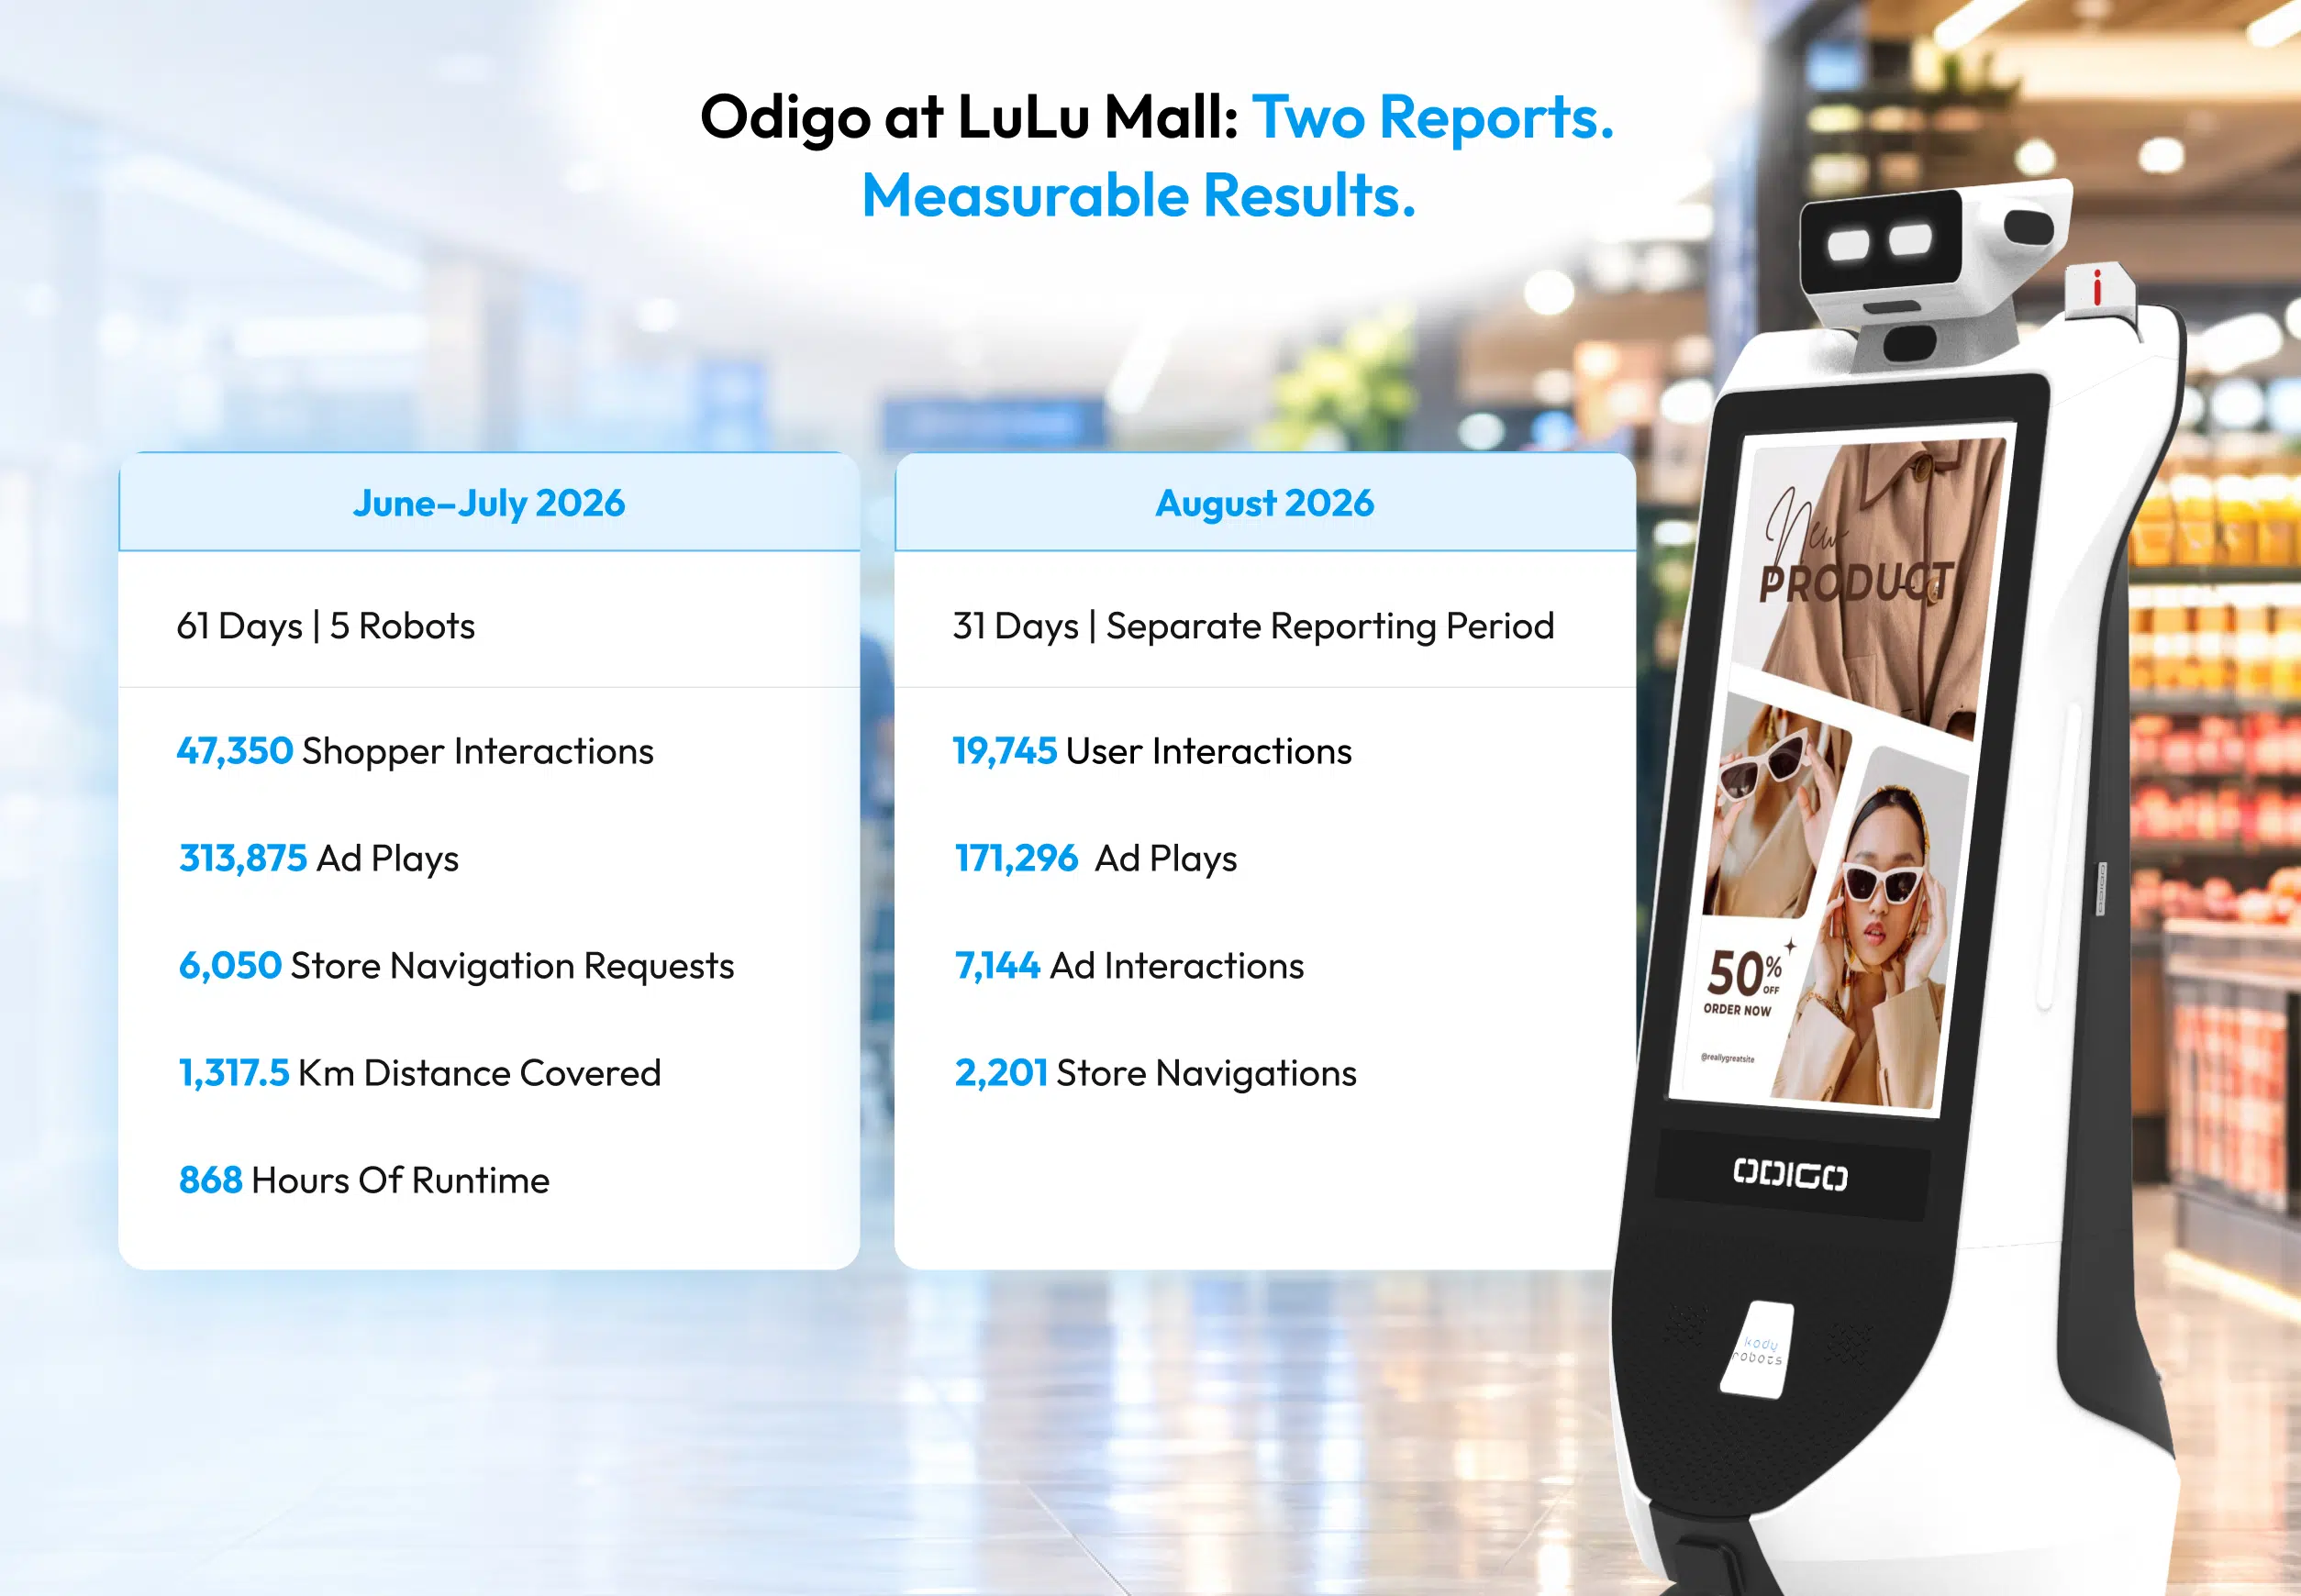
Quick Summary: The Robot in Lulu Mall Case Study reveals what retail robot data can tell mall operators beyond foot traffic and advertising impressions. Over 61 days, five Odigo robots at LuLu Mall Trivandrum recorded 47,350 shopper interactions, delivered 313,875 ad plays, and handled 6,050 store-navigation requests. But what do these numbers mean for retail media performance, shopper behavior, and smarter deployment decisions? This blog examines five practical lessons on robot placement, campaign timing, navigation insights, and performance measurement to help mall operators and advertisers turn deployment data into actionable decisions.
Key Takeaways
- The robot in Lulu Mall case study shows why interaction volume alone cannot determine whether a retail robot is delivering business value.
- Robot placement should match its purpose. High-traffic locations may support advertising exposure, while navigation-focused placements should address visitor needs.
- Ad plays and ad interactions measure different outcomes. Retail media teams need both to understand campaign delivery and shopper response.
- Navigation requests can reveal visitor intent. Destination-level patterns may help identify wayfinding needs and opportunities to improve the mall experience.
- Campaign timing should follow the objective. Comparing performance by time of day can help advertisers make better scheduling decisions.
- Connecting advertising with navigation creates a measurable opportunity. Additional tracking is needed to establish whether campaign exposure leads to store visits or sales.
- Scaling requires evidence, not assumptions. Operational reliability, engagement, campaign performance, navigation activity, and deployment costs should all inform expansion decisions.
The Real Test of a Retail Robot Begins After Deployment
A robot in a shopping mall can attract attention, but attention alone does not tell mall operators whether it is making a difference. The real value lies in what happens next: which stores shoppers look for, where they interact with advertising, and when they are most likely to engage. The robot in Lulu Mall case study provides a practical look at these questions through the deployment of Odigo robots at LuLu Mall Trivandrum.
Over a 61-day reporting period, five Odigo robots recorded 47,350 shopper interactions, delivered 313,875 ad plays, and handled 6,050 store-navigation requests. These figures offer more than a snapshot of robot activity. Together, they help show how mobile advertising and store navigation can provide mall operators with useful insights into shopper behavior.
Odigo robots are also deployed at LuLu Mall locations in Lucknow, Kochi, and Bengaluru. These deployments provide a broader context for understanding how robotic advertising and visitor assistance can fit into different mall environments. The results discussed in this article, however, relate specifically to the reporting period at LuLu Mall Trivandrum.
For retail media teams, the findings raise an important question: how can this data inform decisions about robot placement, campaign timing, and advertising performance? This robot in Lulu Mall case study examines five practical lessons that mall operators and advertisers can apply when planning and evaluating retail robot deployments.
LuLu Trivandrum with Odigo on the Floor
Watch Odigo at work across LuLu Trivandrum, where the robots run campaigns, answer shoppers, and guide them through the aisles. Every play and interaction lands in a measurable record. Set against a pre-deployment baseline and a control store, that record gives retailers the evidence to judge the before and after with confidence.
Lesson 1: Robot Placement Should Reflect How Shoppers Use the Mall
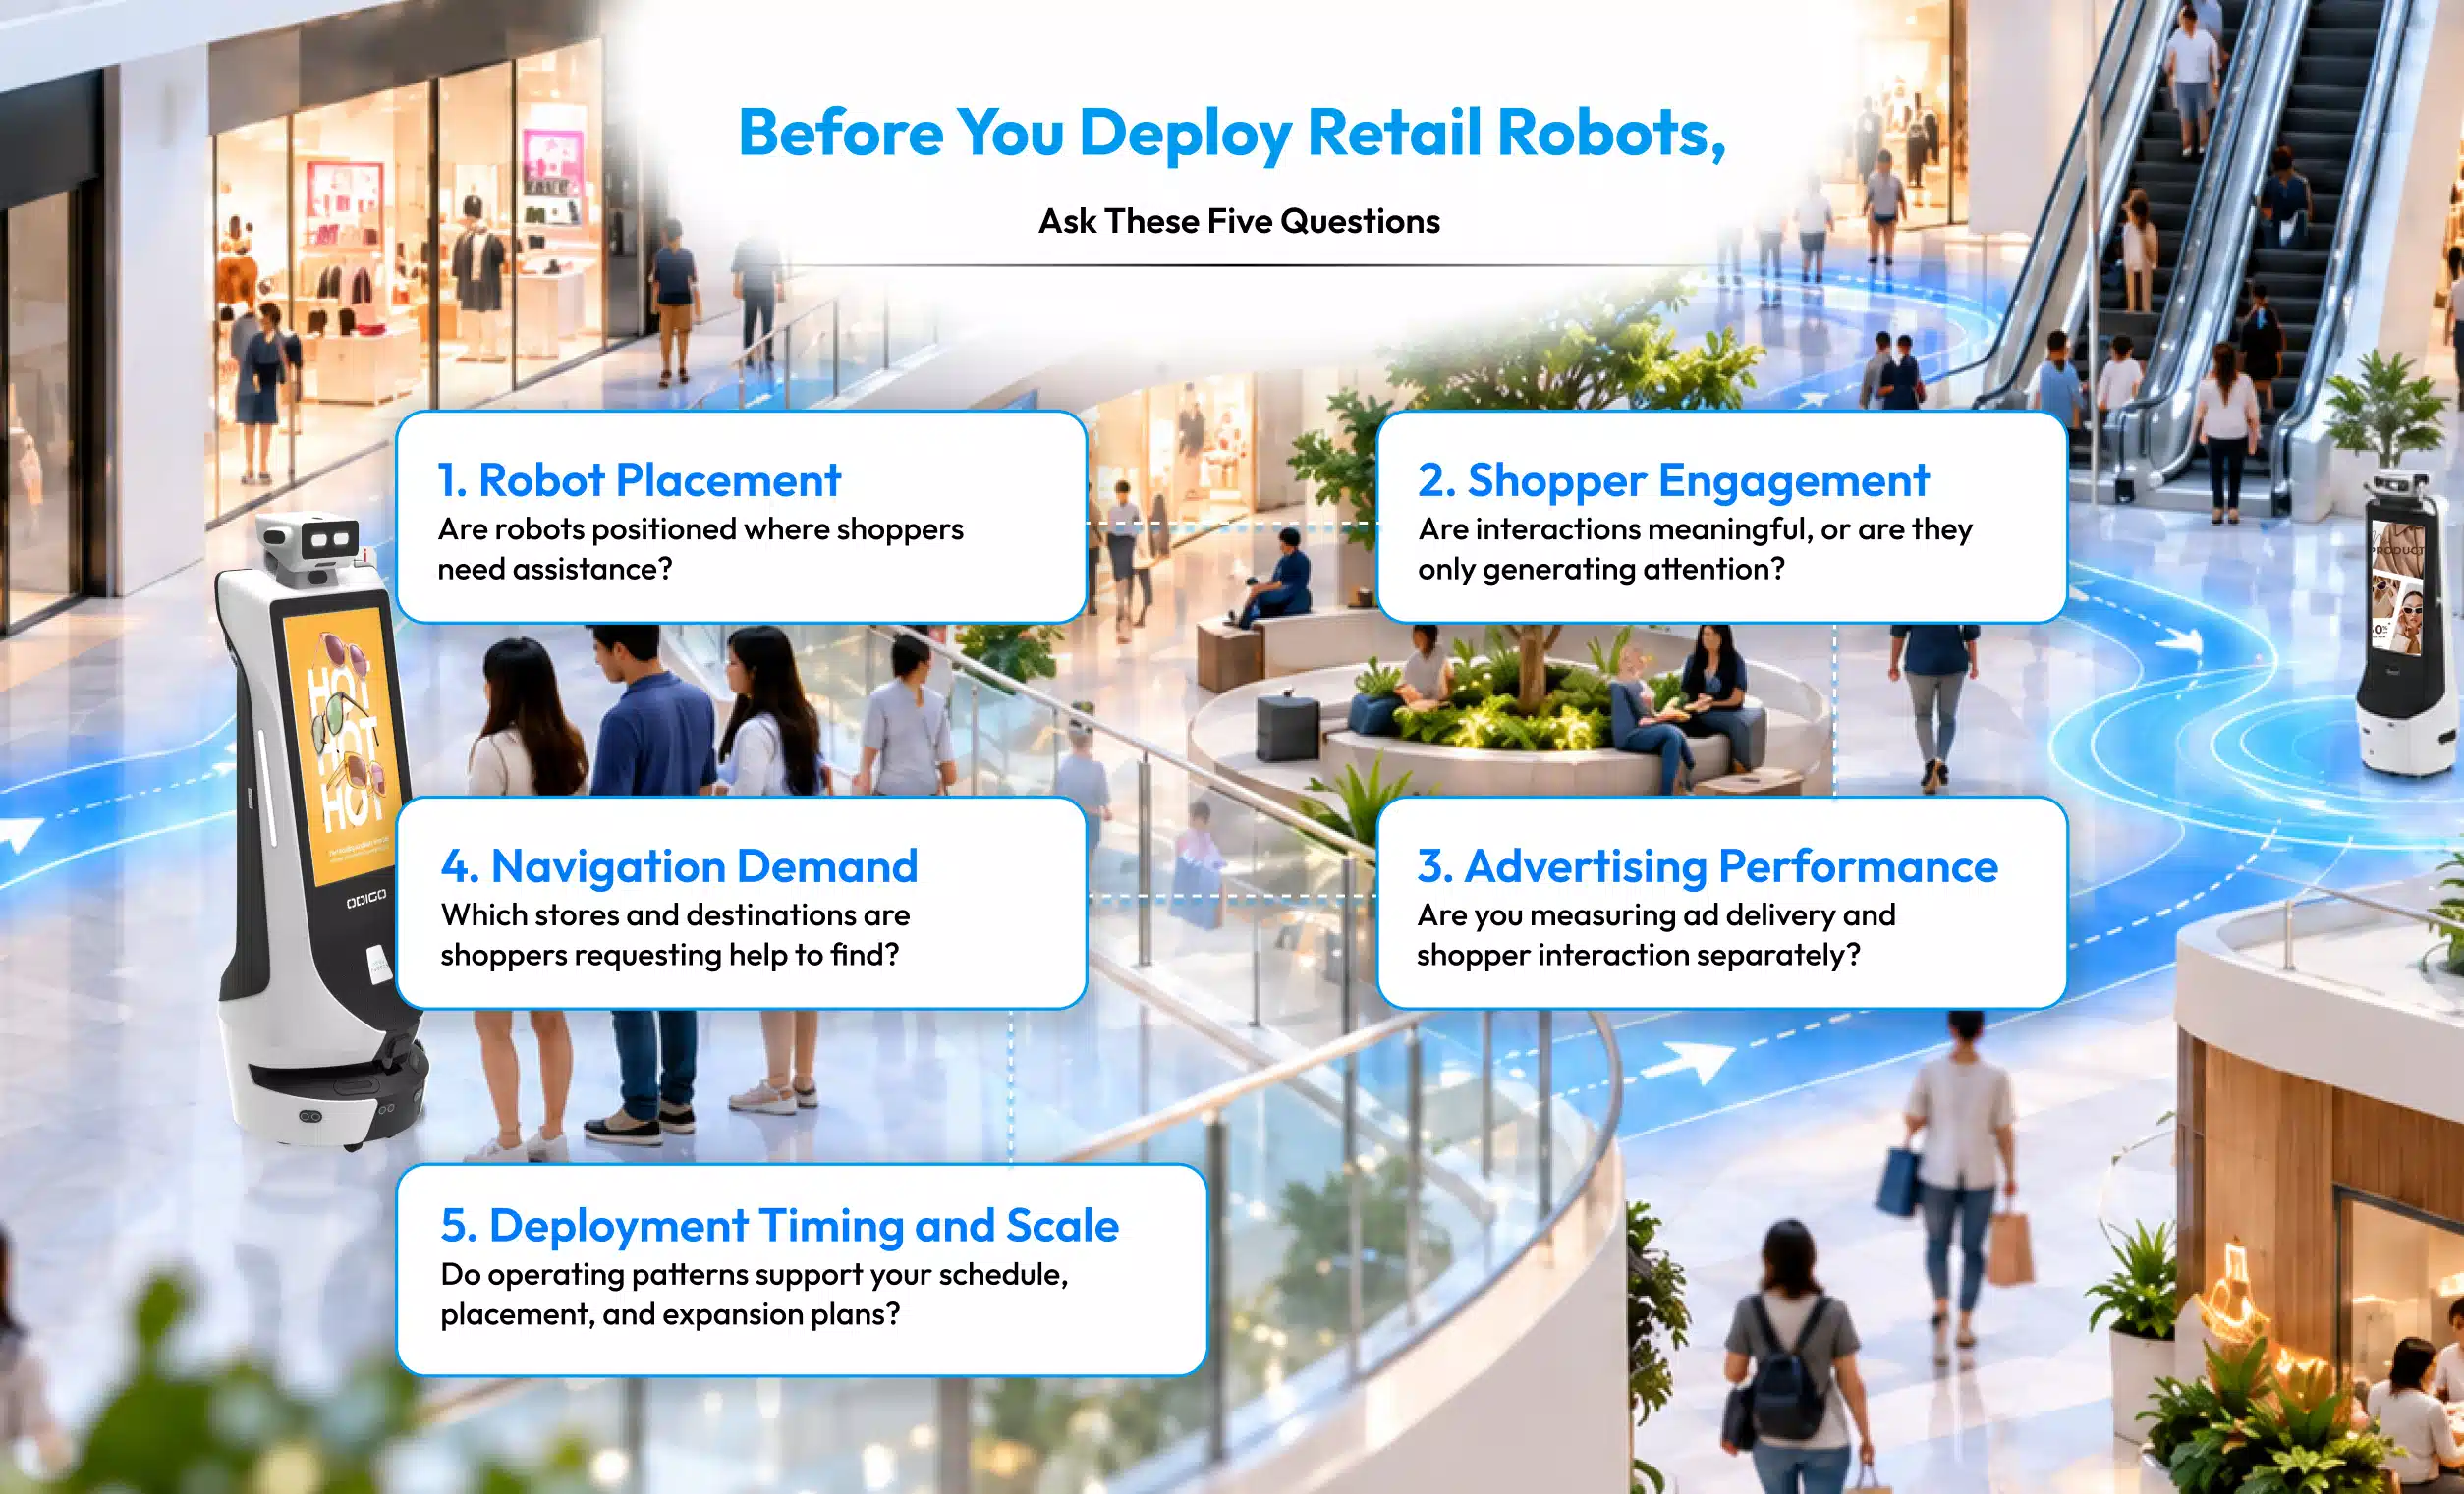
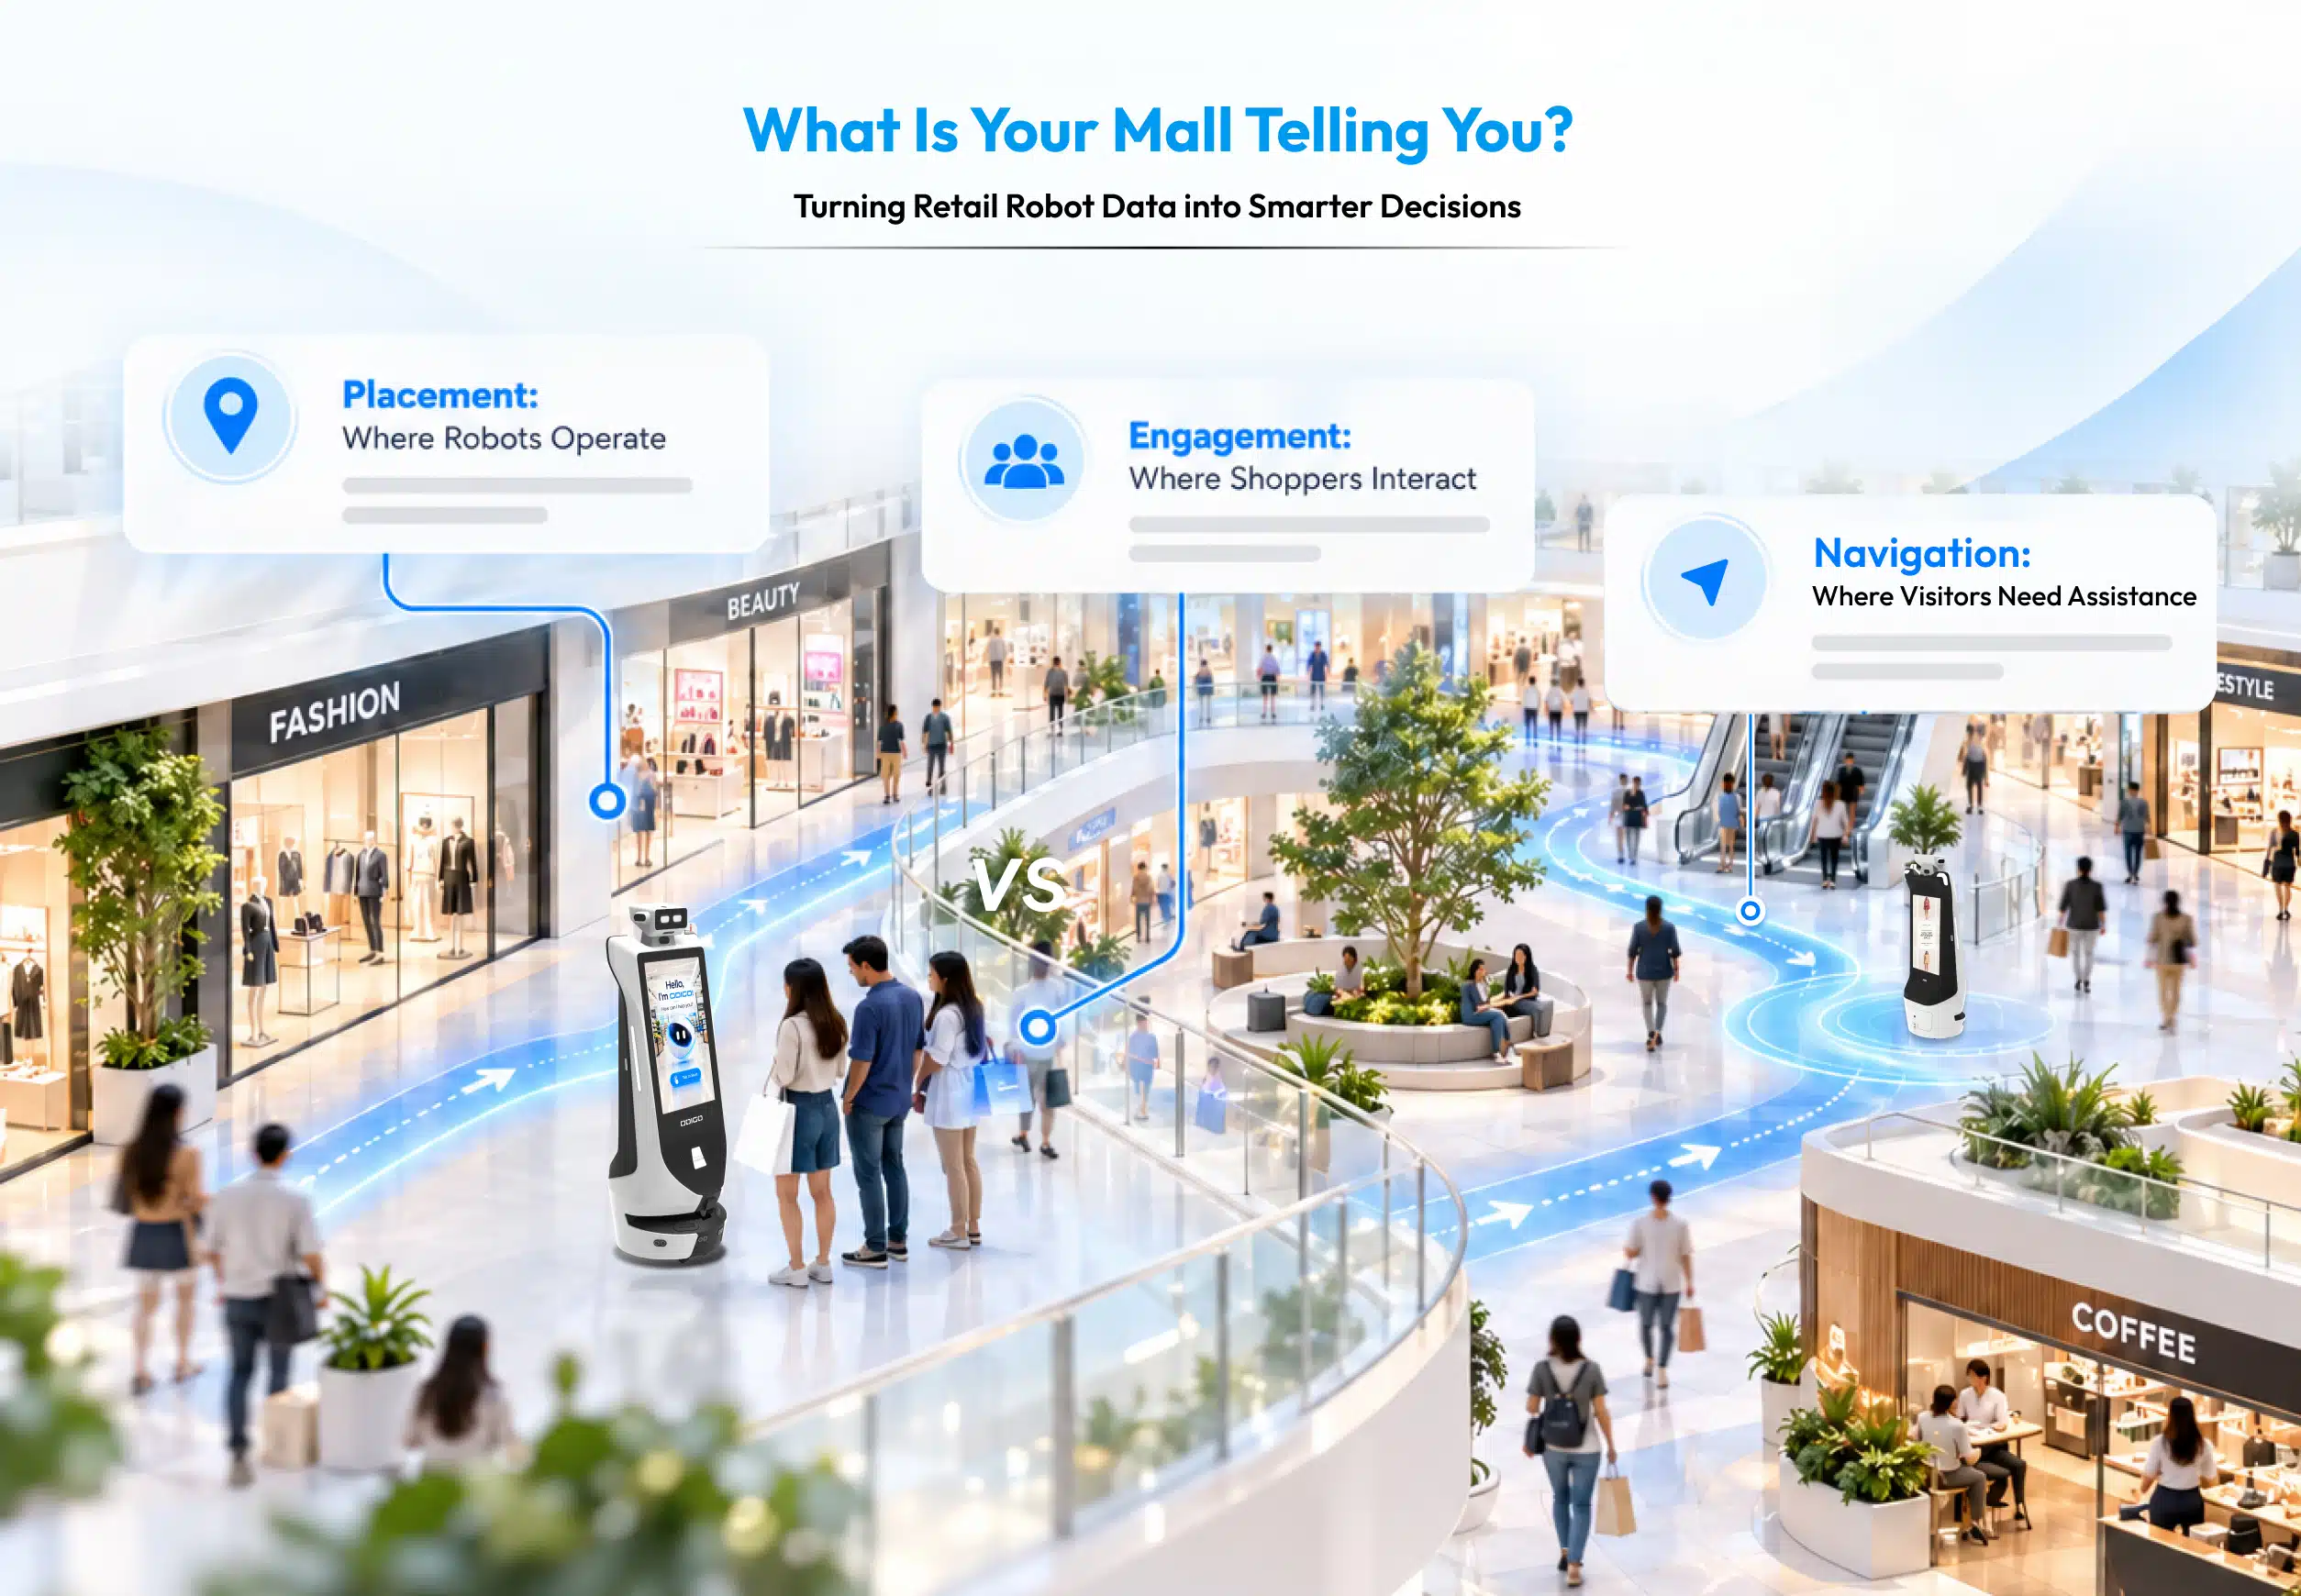
The placement of a retail robot affects the interactions it can generate and the assistance it can provide. A robot positioned in a high-traffic area may attract more attention, while one located where visitors need directions may receive more navigation requests. Mall operators should therefore evaluate placement against the intended purpose rather than treating foot traffic as the only measure of success.
At LuLu Mall Trivandrum, three Odigo robots operated on the ground floor and two on the first floor. During the reporting period, the ground floor recorded 29,862 interactions and 3,822 store-navigation requests. The first floor recorded 17,488 interactions and 2,228 navigation requests.
The ground floor generated a larger share of total interactions, but the figures should be interpreted in context. Floor traffic, robot exposure, store locations, and visitor needs can all influence these results. Interaction totals alone cannot establish that one floor or placement is inherently better.
For a robot deployment Lulu Mall initiative, the first step should be to define what each location is expected to achieve. If the priority is advertising exposure, teams should measure campaign delivery and engagement. If the priority is visitor assistance, navigation requests and completed journeys are more relevant. Where both objectives matter, they should be measured separately.
This is also why before vs after advertising robot in retail can be a useful comparison when evaluating a new deployment. A meaningful assessment requires a baseline, consistent measurement periods, and a clear understanding of other changes that may affect performance.
Lesson 2: Shopper Engagement and Advertising Performance Need Different Metrics
A shopper interacting with a robot and an advertisement being played are two different activities. Combining them into one performance measure can obscure what is actually working. Retail media teams need to distinguish between robot interactions, ad delivery, and the actions shoppers take after seeing an advertisement.
Across the 61-day reporting period, the five robots delivered 313,875 ad plays, averaging approximately 5,145 per day. The ground floor accounted for 198,055 plays, or 63.1% of the total, while the first floor accounted for 115,820, or 36.9%.
Ad Play Distribution Across Mall Floors
The calculations below show how ad plays were distributed across the two floors during the June–July 2026 reporting period.
- Average daily ad plays: 313,875 ÷ 61 = approximately 5,145
- Ground floor share: (198,055 ÷ 313,875) × 100 = 63.1%
- First floor share: (115,820 ÷ 313,875) × 100 = 36.9%
These calculations show the distribution of ad plays, not the number of unique shoppers who viewed the advertisements.
Moreover, these figures quantify campaign delivery, but an ad play does not guarantee that shoppers noticed or acted on the message. Advertisers need additional engagement measures to assess campaign responses.
Additionally, a separate August 2026 report provides another view of advertising activity at LuLu Mall Trivandrum. During the 31-day period, Odigo recorded 171,296 ad plays, 7,144 ad interactions, and 19,745 user interactions. Therefore, teams should measure advertising delivery and shopper interaction separately. Ad plays indicate how often advertisements ran, while ad interactions represent a different type of recorded activity. However, teams should confirm consistent metric definitions before comparing the two reporting periods.
When comparing formats, advertising robot vs interactive kiosk vs digital signage is a useful consideration for businesses choosing how to deliver messages. Fixed screens, interactive kiosks, and mobile advertising robots offer different ways to reach visitors. Ultimately, the right choice depends on campaign goals, placement, audience movement, and available performance metrics.
For an advertising robot in LuLu Mall, teams should assess ad plays alongside ad interactions, time of day, placement, and campaign objectives. This approach separates delivery volume from audience response and helps advertisers evaluate future campaigns.
Lesson 3: Store Navigation Data Can Reveal What Shoppers Want
Store-navigation requests provide a different kind of insight from advertising metrics. They can indicate where visitors need assistance and which destinations they are actively trying to reach. When recorded consistently, these requests can help mall operators understand visitor needs and identify opportunities to improve wayfinding.
During the June-July reporting period, Odigo robot in LuLu Mall Trivandrum recorded 6,050 store-navigation requests and 47,350 shopper interactions across five robots deployed on two floors. Dividing navigation requests by shopper interactions gives a navigation-to-interaction ratio of approximately 12.8% (6,050 ÷ 47,350 × 100).
Understanding Store Navigation Metrics
This ratio compares two recorded activity counts; it does not necessarily represent the percentage of unique shoppers who requested navigation or completed a journey. Multiple interactions may come from the same shopper, and a navigation request does not confirm successful arrival at the destination. The ratio should therefore be interpreted as a measure of recorded navigation activity relative to total interactions, not as a unique-shopper conversion rate or completed-journey rate.
Navigation data becomes more useful when analyzed by destination, floor, time, and day. Repeated requests for the same store could point to a need for clearer signs, better directional information, or more visible wayfinding support. Changes over time may also help mall teams understand how campaigns, seasonal events, or store promotions affect visitor interest.
According to Odigo robot in Lulu Mall Trivandrum case study, the August 2026 report recorded 2,201 store navigations, providing a separate snapshot of navigation activity. This figure offers another reporting period for examining how shoppers use Odigo to find destinations. However, it should not be directly compared with the 6,050 store-navigation requests recorded during June and July without accounting for the different reporting durations and confirming that both reports use the same metric definitions. Navigation requests indicate demand for directions, but they do not necessarily confirm that shoppers completed their journeys or visited the intended stores.
A well-planned in-store robot data collection process can support this type of analysis when data is collected responsibly and interpreted in context. The objective is not simply to gather more information, but to identify patterns that can inform operational decisions.
For the Lulu Mall robot deployment, navigation requests should be reviewed alongside destination-level data and visitor feedback wherever available. This can help distinguish between high demand for a destination and friction in reaching it.
Lesson 4: The Best Time to Run a Campaign Depends on Its Objective
Campaign timing can influence whether an advertisement reaches shoppers when they are most receptive. However, the busiest period is not always the best period for every campaign. A brand aiming for broad visibility may prioritize delivery volume, while a campaign designed to encourage immediate engagement may focus on periods when shoppers are more likely to interact.
The June-July report divides operating hours into four dayparts: morning (10 a.m. to 1 p.m.), afternoon (1 p.m. to 4 p.m.), evening peak (4 p.m. to 7 p.m.), and late evening (7 p.m. to 10 p.m.). Together, these time windows provide a framework for aligning advertising campaigns with different retail objectives. Before selecting specific time slots, campaign teams should review verified, time-specific ad interaction data and confirm how interaction rates are calculated. This approach helps advertisers make scheduling decisions based on measured engagement rather than ad plays alone.
For example, a campaign promoting a dining offer may have different timing requirements from one advertising a store opening or a seasonal sale. By comparing delivery and interaction rates across dayparts, teams can better understand which periods support each campaign objective.
Similarly, retailers can use why supermarkets deploy robots to understand how automation can support operational efficiency and improve the customer experience. Although supermarkets and shopping malls have different layouts and visitor needs, both environments benefit from defining the intended outcome before choosing a technology or evaluating its performance.
Therefore, the practical takeaway from this robot in Lulu Mall case study is to test campaign timing against a defined goal. Record the results, compare similar periods, and adjust schedules based on observed performance rather than relying on assumptions about peak shopping hours.
Lesson 5: Advertising Becomes More Actionable When It Connects with Navigation
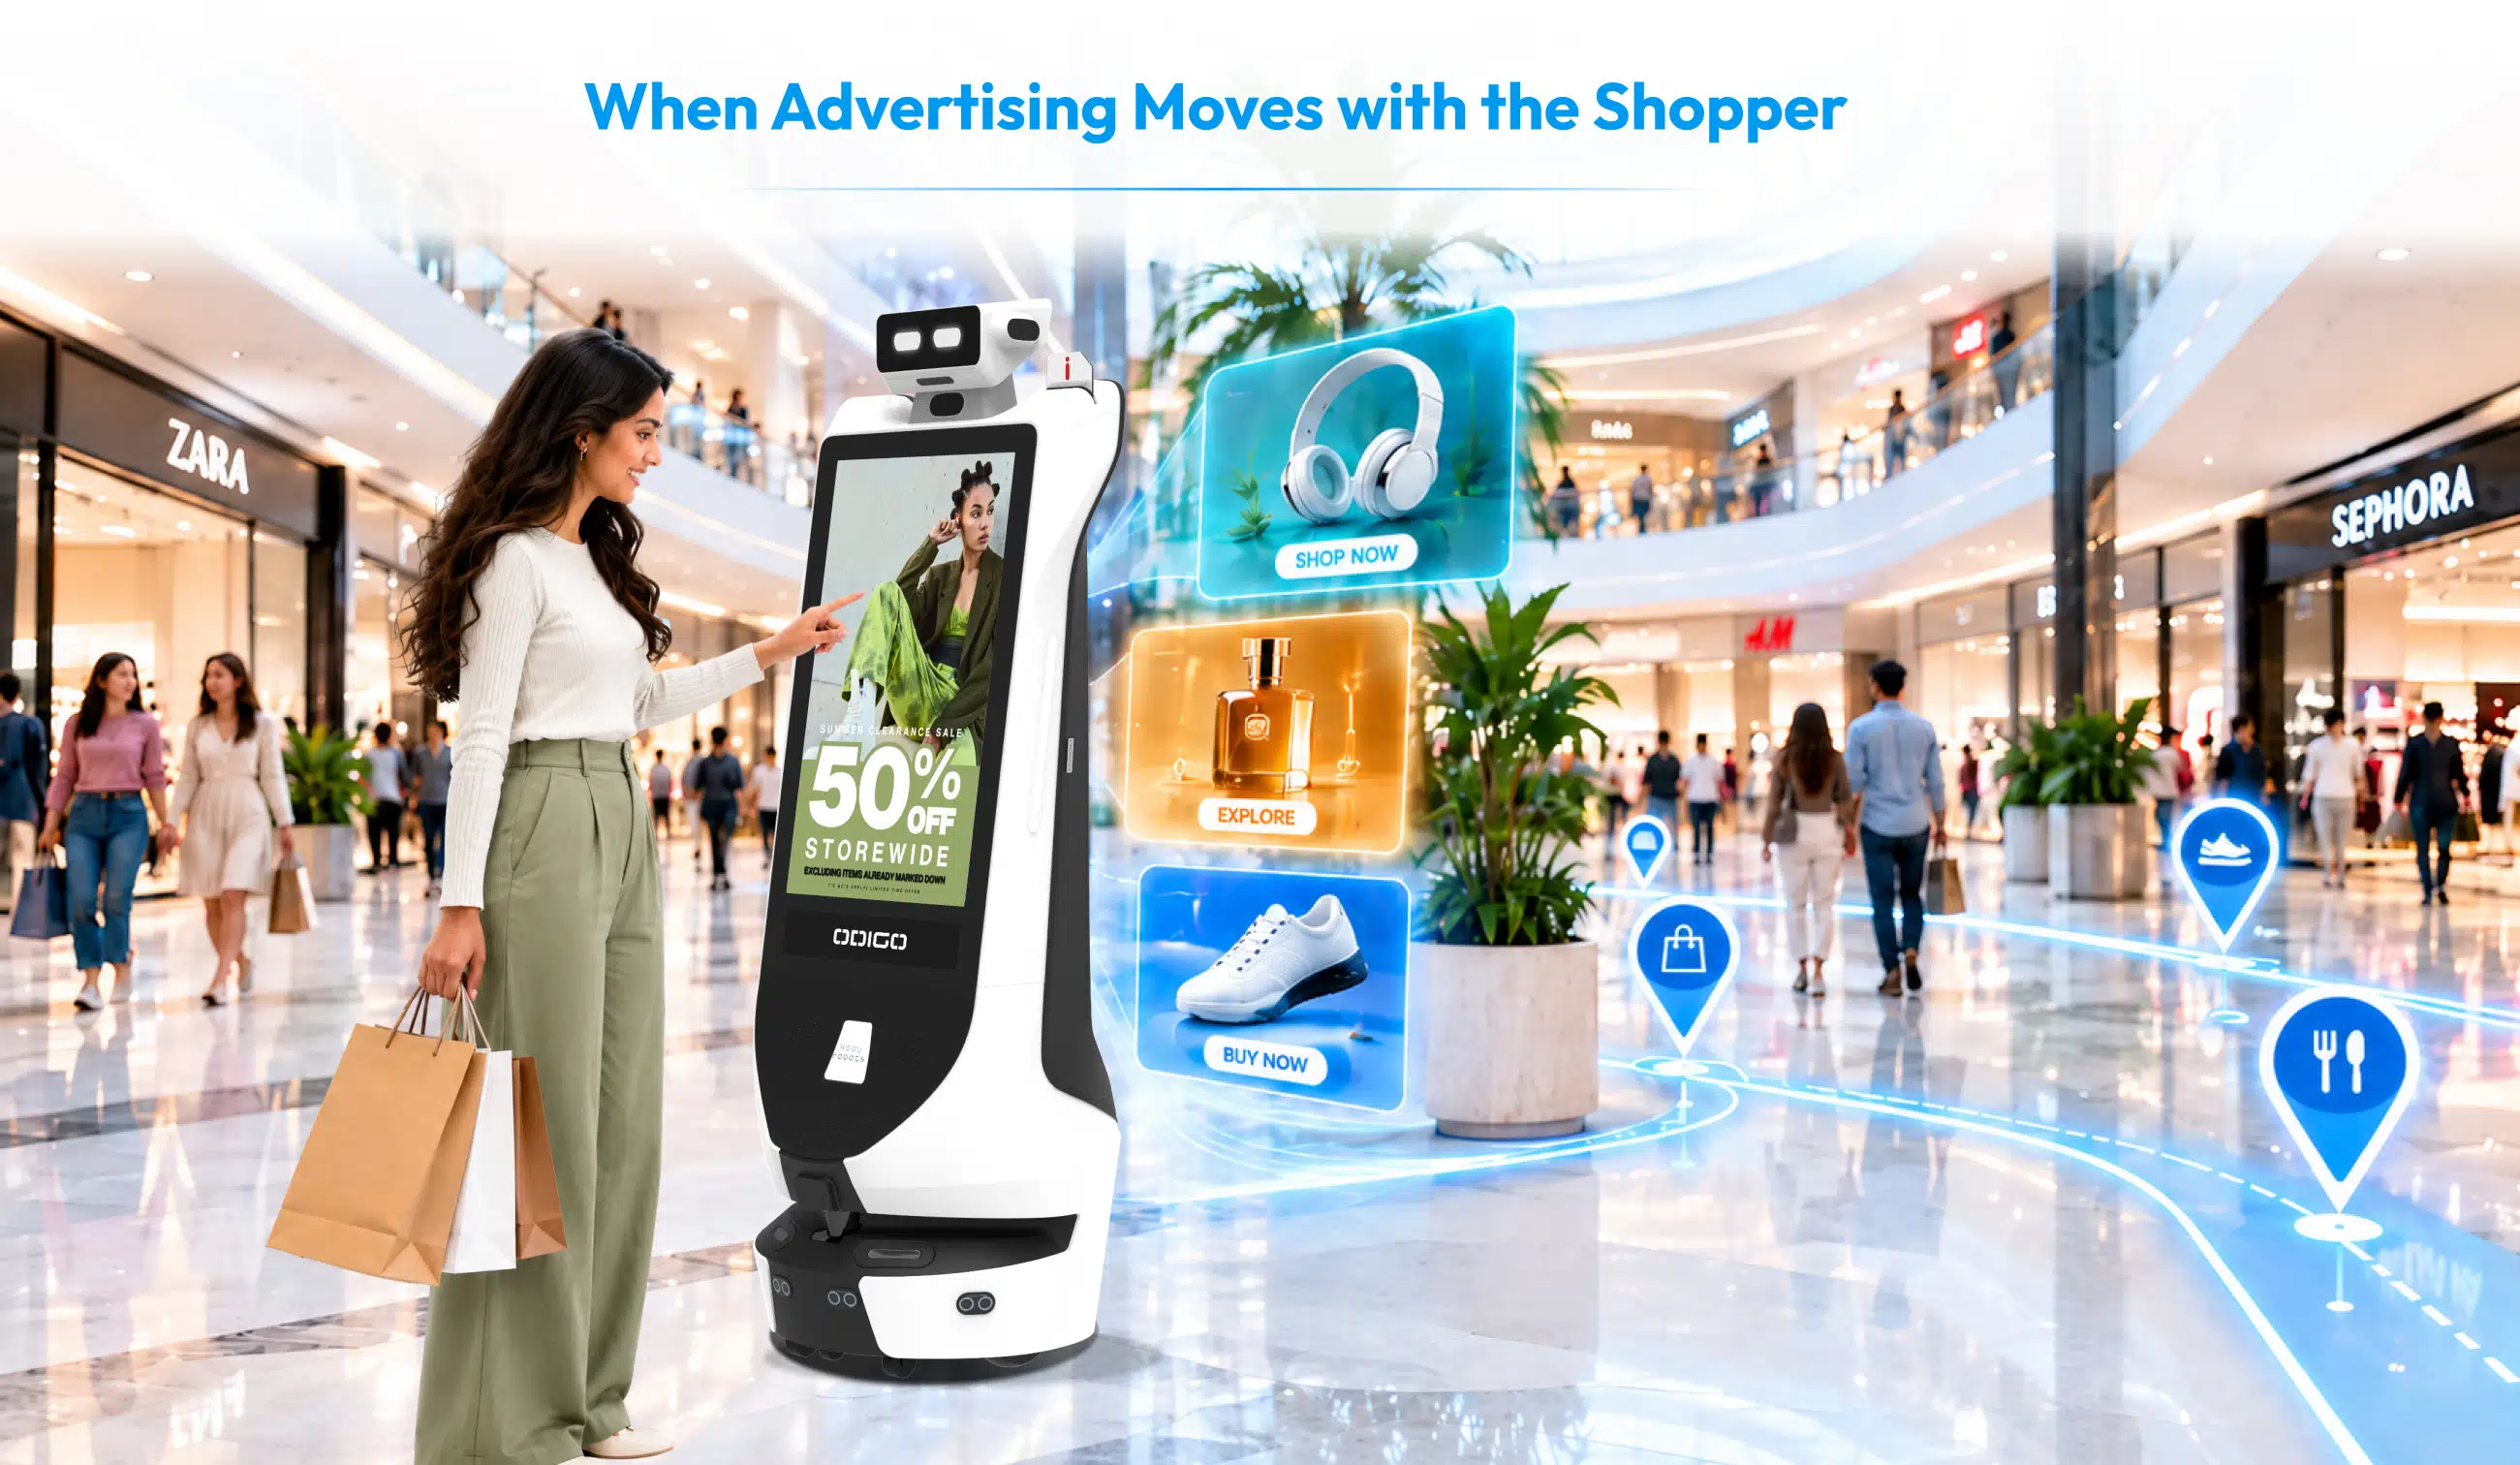
Advertising can introduce shoppers to a product, brand, or store. Navigation can then help them reach a destination. When these functions work together, a retail robot can support more of the shopper’s journey than a screen that only displays promotional content.
Consider a shopper who sees an advertisement for a store inside the mall. If the shopper wants to visit that store, a navigation feature can provide directions and help make the next step easier. This creates a potential connection between promotional exposure and a practical action.
However, the available June–July figures do not establish that a particular advertisement led to a specific navigation request or store visit. To demonstrate that relationship, operators would need campaign-level tracking, consistent timestamps, destination data, and a clear method for connecting an advertising interaction to a subsequent action.
This is why, how advertising robot boost sales should be evaluated through measurable outcomes rather than assumed benefits. Ad delivery and navigation activity can indicate engagement and intent, but confirmed sales impact requires additional evidence, such as attributable conversions or sales data.
For the Odigo robot deployment case study, the next step would be to assess whether campaigns linked to specific stores generate more relevant navigation activity during comparable periods. That analysis could help advertisers understand whether connecting media with wayfinding improves the usefulness of a campaign.
What Mall Operators Should Measure Before Expanding a Robot Deployment
A successful pilot should give operators enough evidence to decide what to maintain, improve, or scale. However, the number of robots deployed is only one part of that decision. Operators also need to understand how consistently robots operate, how shoppers use them, and whether the results support the original business objectives.
The report records 1,317.5 kilometers traveled and 868 runtime hours across the five robots. Additionally, it shows that the robots spent 70.5% of their runtime cruising and 29.5% navigating. Although these figures provide useful operational context, they do not independently establish cost savings, staffing reductions, or return on investment.
Before expanding a deployment, mall teams should assess several areas:
Operational reliability
Track runtime, downtime, charging requirements, and the percentage of scheduled hours during which each robot is available.
Shopper engagement
Measure interactions by location, day, and time to understand where engagement occurs.
Advertising delivery
Monitor ad plays, campaign distribution, interaction rates, and performance by daypart.
Navigation usefulness
Record navigation requests, completed journeys where measurable, popular destinations, and repeat requests.
Commercial outcomes
Where data is available, assess whether campaigns contribute to store visits, lead generation, or sales.
Deployment costs
Compare hardware, maintenance, software, staffing, and campaign management costs with the benefits that can be substantiated.
Furthermore, a structured why retail robots fail assessment can help teams identify potential problems before scaling. For example, common risks to evaluate include poor placement, unclear use cases, weak campaign measurement, operational interruptions, and a mismatch between robot capabilities and visitor needs.
Similarly, the robot network configuration should be considered when planning a larger deployment. Operators need to determine how robots will be distributed across floors and zones. They should also establish operating schedules and performance-monitoring processes across the network. Without addressing these requirements, scaling may make the deployment harder to manage.
More importantly, a useful evaluation framework should connect each metric with a decision. For example, low engagement in a particular zone may prompt a placement review, while strong navigation demand for a destination may justify improving directional support. As a result, reporting becomes a practical tool for improving operations.
Ultimately, the robot in Lulu Mall case study provides a starting point by showing how interaction, advertising, navigation, and operating data can be assessed together. Operators should use this evidence to establish a baseline, test improvements, and expand only when the results justify it.
The Value of a Retail Robot Deployment Lies in What You Learn from It
The deployment at LuLu Mall Trivandrum demonstrates how retail robots can generate several types of operational data within one shopping environment. Across 61 days, five Odigo robots recorded 47,350 shopper interactions, delivered 313,875 ad plays, and handled 6,050 store-navigation requests.
A separate report covering August 2026 recorded 19,745 user interactions, 171,296 ad plays, 7,144 ad interactions, and 2,201 store navigations. Together, the two reporting periods provide data on advertising delivery, recorded engagement, and navigation activity at LuLu Mall Trivandrum. However, compare each period separately, ensuring consistent metric definitions and accounting for differences in reporting durations.
These figures help mall operators understand activity across advertising and visitor assistance. Furthermore, these figures raise questions about effective placement, campaign timing, and visitor engagement. Navigation data can also help improve the visitor experience.
The findings should not be treated as proof of increased sales or a guaranteed return on investment. Instead, they provide a practical foundation for setting performance benchmarks, testing improvements, and connecting robot activity with measurable business outcomes.
For businesses evaluating AI robots in Lulu Mall and similar retail environments, the main lesson is to plan measurement alongside deployment. Define the objective, collect relevant data, review the results, and use the evidence to guide the next decision.
Bring Odigo to your retail environment and build a more measurable approach to in-store advertising, shopper engagement, and store discovery.

Robot in Lulu Mall Case Study – General FAQs
The robot in Lulu Mall case study offers practical references for businesses assessing retail robot performance. These FAQs cover advertising metrics, store navigation, deployment planning, and how retailers can evaluate the value of robotic solutions.
1. What does the robot in Lulu Mall case study reveal about retail robot performance?
The robot in Lulu Mall case study reports 47,350 shopper interactions, 313,875 ad plays, and 6,050 store-navigation requests recorded by five Odigo robots over 61 days in June–July 2026. The figures provide a baseline for assessing shopper engagement, advertising delivery, and navigation activity. They do not independently establish sales growth or return on investment.
2. Where are Odigo robots deployed at LuLu Mall locations?
Odigo Advertising Robots are deployed at LuLu Mall locations in Lucknow, Trivandrum, Kochi, and Bengaluru. Each mall may have different visitor patterns, operational requirements, and campaign objectives. The findings in this article relate specifically to the five robots covered by June–July 2026 and a separate August 2026 report for LuLu Mall Trivandrum.
3. How can mall operators measure the effectiveness of advertising robots?
Mall operators can track ad plays, ad interaction rates, shopper interactions, navigation requests, operational uptime, and performance by location and time of day. They should also define how each metric relates to the campaign objective. To assess commercial impact, operators need additional evidence connecting campaign activity with outcomes such as store visits, leads, or sales.
4. How can a robot in a mall support store navigation?
An AI robot assistant like Odigo can help visitors locate stores and provide directions to their destinations. Navigation-request data can also help operators identify frequently requested destinations and areas where visitors may need more assistance. To evaluate the service properly, teams should distinguish between requests received and journeys successfully completed.
5. What is the difference between advertising delivery and advertising engagement?
Advertising delivery measures how often an advertisement is played or displayed. Advertising engagement measures the interactions associated with that content, according to the tracking method being used. High delivery volume does not automatically mean that shoppers noticed the message or acted on it, so both measures should be reviewed separately.
6. How do advertising robots compare with static screens in supermarkets?
Static screens display content from fixed locations, while advertising robots move through designated areas and offer interactive assistance. The appropriate solution depends on the environment, campaign goals, operational requirements, and available measurement capabilities. The static screens vs advertising robot in supermarkets comparison can help retailers assess the trade-offs when planning an in-store media strategy.
7. What is the business model behind advertising robots?
An advertising robot business model can involve deploying robots in commercial venues and generating revenue through paid advertising placements or campaigns. The structure depends on robot ownership, media sales, campaign management, and the allocation of revenue and operating costs. The advertising robot business model framework can help businesses understand these considerations.
8. What should businesses consider when choosing advertising robots?
Businesses should evaluate the intended use case, navigation capabilities, screen and content requirements, safety, maintenance, deployment costs, and reporting features. They should also establish success metrics before deployment so they can judge whether the solution meets operational and commercial objectives. The best advertising robots for US supermarkets is relevant for retailers to assess solutions for supermarket environments.
9. How can businesses evaluate the return on investment of a retail robot deployment?
Businesses should compare the total cost of deployment and operation with measurable benefits. Depending on the use case, these may include advertising revenue, campaign engagement, reduced manual workload, or improvements in visitor assistance. Each benefit should be supported by suitable data, and results should be compared against a defined baseline before drawing conclusions.
10. Where can businesses learn more about Odigo and its developer?
Businesses can learn more about Odigo’s capabilities, applications, and deployment possibilities through Kody Robots. As a robotics company in India, Kody Robots specializes in intelligent robotic solutions for commercial environments.